South American Indian vs Spanish American In Labor Force | Age 30-34
COMPARE
South American Indian
Spanish American
In Labor Force | Age 30-34
In Labor Force | Age 30-34 Comparison
South American Indians
Spanish Americans
84.7%
IN LABOR FORCE | AGE 30-34
52.1/ 100
METRIC RATING
169th/ 347
METRIC RANK
83.5%
IN LABOR FORCE | AGE 30-34
0.0/ 100
METRIC RATING
270th/ 347
METRIC RANK
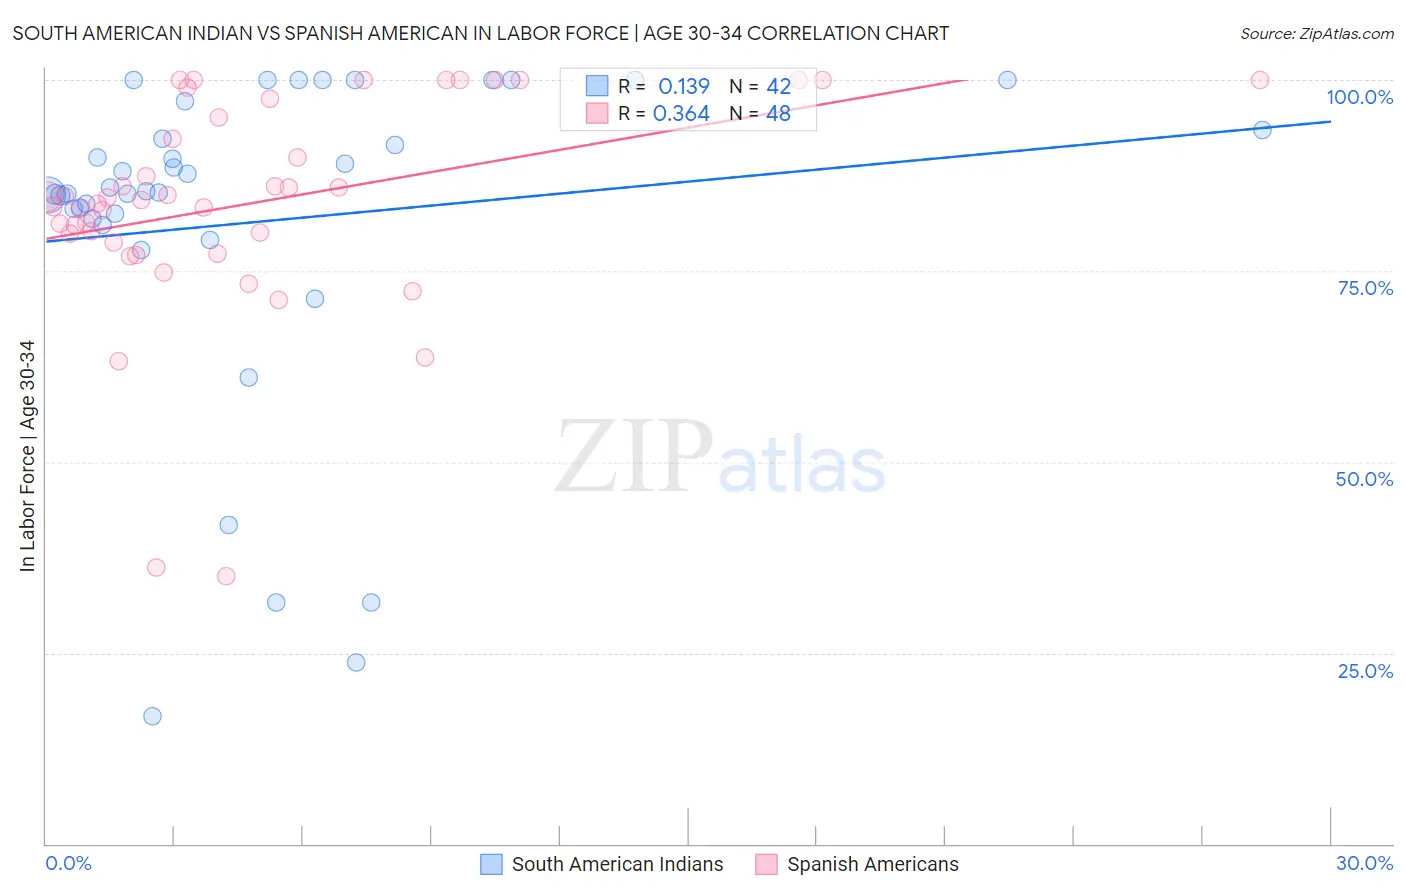
South American Indian vs Spanish American In Labor Force | Age 30-34 Correlation Chart
The statistical analysis conducted on geographies consisting of 164,535,874 people shows a poor positive correlation between the proportion of South American Indians and labor force participation rate among population between the ages 30 and 34 in the United States with a correlation coefficient (R) of 0.139 and weighted average of 84.7%. Similarly, the statistical analysis conducted on geographies consisting of 103,148,754 people shows a mild positive correlation between the proportion of Spanish Americans and labor force participation rate among population between the ages 30 and 34 in the United States with a correlation coefficient (R) of 0.364 and weighted average of 83.5%, a difference of 1.4%.
In Labor Force | Age 30-34 Correlation Summary
| Measurement | South American Indian | Spanish American |
| Minimum | 16.7% | 35.0% |
| Maximum | 100.0% | 100.0% |
| Range | 83.3% | 65.0% |
| Mean | 81.4% | 83.9% |
| Median | 85.3% | 84.4% |
| Interquartile 25% (IQ1) | 81.8% | 79.3% |
| Interquartile 75% (IQ3) | 93.5% | 96.3% |
| Interquartile Range (IQR) | 11.7% | 17.1% |
| Standard Deviation (Sample) | 21.4% | 14.2% |
| Standard Deviation (Population) | 21.1% | 14.1% |
Similar Demographics by In Labor Force | Age 30-34
Demographics Similar to South American Indians by In Labor Force | Age 30-34
In terms of in labor force | age 30-34, the demographic groups most similar to South American Indians are Immigrants from Peru (84.7%, a difference of 0.0%), Immigrants from Burma/Myanmar (84.7%, a difference of 0.0%), Irish (84.7%, a difference of 0.0%), Immigrants from England (84.7%, a difference of 0.0%), and Immigrants from South Eastern Asia (84.7%, a difference of 0.010%).
| Demographics | Rating | Rank | In Labor Force | Age 30-34 |
| South Americans | 58.7 /100 | #162 | Average 84.7% |
| Immigrants | Uruguay | 57.4 /100 | #163 | Average 84.7% |
| Icelanders | 56.8 /100 | #164 | Average 84.7% |
| Immigrants | Western Europe | 56.7 /100 | #165 | Average 84.7% |
| Afghans | 55.2 /100 | #166 | Average 84.7% |
| Immigrants | South Eastern Asia | 54.2 /100 | #167 | Average 84.7% |
| Immigrants | Peru | 52.4 /100 | #168 | Average 84.7% |
| South American Indians | 52.1 /100 | #169 | Average 84.7% |
| Immigrants | Burma/Myanmar | 52.0 /100 | #170 | Average 84.7% |
| Irish | 52.0 /100 | #171 | Average 84.7% |
| Immigrants | England | 51.7 /100 | #172 | Average 84.7% |
| Israelis | 51.1 /100 | #173 | Average 84.7% |
| Finns | 50.0 /100 | #174 | Average 84.7% |
| Immigrants | South America | 50.0 /100 | #175 | Average 84.7% |
| Immigrants | Uzbekistan | 49.1 /100 | #176 | Average 84.7% |
Demographics Similar to Spanish Americans by In Labor Force | Age 30-34
In terms of in labor force | age 30-34, the demographic groups most similar to Spanish Americans are Spanish (83.5%, a difference of 0.020%), Nonimmigrants (83.5%, a difference of 0.020%), Vietnamese (83.6%, a difference of 0.050%), Immigrants from Bangladesh (83.6%, a difference of 0.060%), and Spaniard (83.6%, a difference of 0.070%).
| Demographics | Rating | Rank | In Labor Force | Age 30-34 |
| Immigrants | Guyana | 0.2 /100 | #263 | Tragic 83.8% |
| Guatemalans | 0.2 /100 | #264 | Tragic 83.7% |
| Immigrants | Honduras | 0.1 /100 | #265 | Tragic 83.7% |
| Immigrants | Guatemala | 0.1 /100 | #266 | Tragic 83.7% |
| Spaniards | 0.1 /100 | #267 | Tragic 83.6% |
| Immigrants | Bangladesh | 0.1 /100 | #268 | Tragic 83.6% |
| Vietnamese | 0.1 /100 | #269 | Tragic 83.6% |
| Spanish Americans | 0.0 /100 | #270 | Tragic 83.5% |
| Spanish | 0.0 /100 | #271 | Tragic 83.5% |
| Immigrants | Nonimmigrants | 0.0 /100 | #272 | Tragic 83.5% |
| Guamanians/Chamorros | 0.0 /100 | #273 | Tragic 83.5% |
| Belizeans | 0.0 /100 | #274 | Tragic 83.5% |
| Immigrants | Grenada | 0.0 /100 | #275 | Tragic 83.5% |
| Tongans | 0.0 /100 | #276 | Tragic 83.5% |
| Delaware | 0.0 /100 | #277 | Tragic 83.5% |