Trinidadian and Tobagonian vs Venezuelan In Labor Force | Age 25-29
COMPARE
Trinidadian and Tobagonian
Venezuelan
In Labor Force | Age 25-29
In Labor Force | Age 25-29 Comparison
Trinidadians and Tobagonians
Venezuelans
83.9%
IN LABOR FORCE | AGE 25-29
0.7/ 100
METRIC RATING
240th/ 347
METRIC RANK
84.4%
IN LABOR FORCE | AGE 25-29
15.1/ 100
METRIC RATING
204th/ 347
METRIC RANK
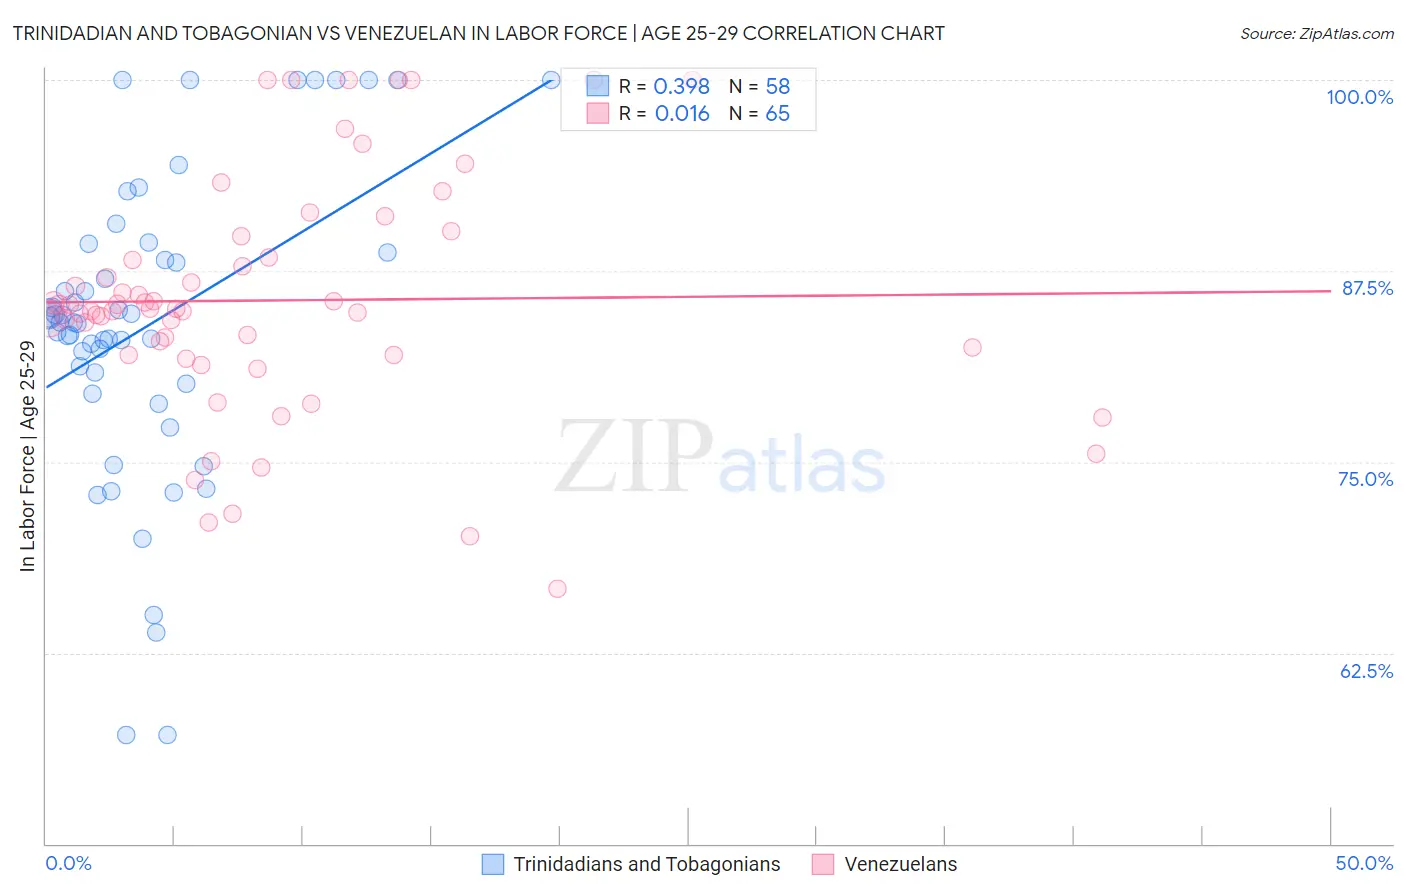
Trinidadian and Tobagonian vs Venezuelan In Labor Force | Age 25-29 Correlation Chart
The statistical analysis conducted on geographies consisting of 219,834,546 people shows a mild positive correlation between the proportion of Trinidadians and Tobagonians and labor force participation rate among population between the ages 25 and 29 in the United States with a correlation coefficient (R) of 0.398 and weighted average of 83.9%. Similarly, the statistical analysis conducted on geographies consisting of 306,279,801 people shows no correlation between the proportion of Venezuelans and labor force participation rate among population between the ages 25 and 29 in the United States with a correlation coefficient (R) of 0.016 and weighted average of 84.4%, a difference of 0.59%.
In Labor Force | Age 25-29 Correlation Summary
| Measurement | Trinidadian and Tobagonian | Venezuelan |
| Minimum | 57.1% | 66.7% |
| Maximum | 100.0% | 100.0% |
| Range | 42.9% | 33.3% |
| Mean | 83.9% | 85.6% |
| Median | 84.2% | 85.0% |
| Interquartile 25% (IQ1) | 80.1% | 82.0% |
| Interquartile 75% (IQ3) | 88.7% | 89.1% |
| Interquartile Range (IQR) | 8.6% | 7.1% |
| Standard Deviation (Sample) | 10.0% | 7.7% |
| Standard Deviation (Population) | 9.9% | 7.6% |
Similar Demographics by In Labor Force | Age 25-29
Demographics Similar to Trinidadians and Tobagonians by In Labor Force | Age 25-29
In terms of in labor force | age 25-29, the demographic groups most similar to Trinidadians and Tobagonians are Jamaican (83.9%, a difference of 0.0%), Immigrants from Uzbekistan (83.9%, a difference of 0.010%), Alsatian (83.9%, a difference of 0.020%), Iraqi (83.9%, a difference of 0.040%), and Guamanian/Chamorro (83.9%, a difference of 0.040%).
| Demographics | Rating | Rank | In Labor Force | Age 25-29 |
| Immigrants | Western Asia | 2.7 /100 | #233 | Tragic 84.1% |
| Barbadians | 1.0 /100 | #234 | Tragic 83.9% |
| Iraqis | 0.9 /100 | #235 | Tragic 83.9% |
| Guamanians/Chamorros | 0.9 /100 | #236 | Tragic 83.9% |
| Immigrants | Immigrants | 0.9 /100 | #237 | Tragic 83.9% |
| Immigrants | Uzbekistan | 0.8 /100 | #238 | Tragic 83.9% |
| Jamaicans | 0.8 /100 | #239 | Tragic 83.9% |
| Trinidadians and Tobagonians | 0.7 /100 | #240 | Tragic 83.9% |
| Alsatians | 0.7 /100 | #241 | Tragic 83.9% |
| U.S. Virgin Islanders | 0.6 /100 | #242 | Tragic 83.8% |
| Salvadorans | 0.5 /100 | #243 | Tragic 83.8% |
| Immigrants | Jamaica | 0.4 /100 | #244 | Tragic 83.8% |
| Iroquois | 0.4 /100 | #245 | Tragic 83.8% |
| Cree | 0.3 /100 | #246 | Tragic 83.8% |
| Immigrants | El Salvador | 0.3 /100 | #247 | Tragic 83.7% |
Demographics Similar to Venezuelans by In Labor Force | Age 25-29
In terms of in labor force | age 25-29, the demographic groups most similar to Venezuelans are Ecuadorian (84.4%, a difference of 0.0%), Afghan (84.4%, a difference of 0.010%), Immigrants from Afghanistan (84.4%, a difference of 0.010%), Immigrants from Cambodia (84.4%, a difference of 0.010%), and Laotian (84.4%, a difference of 0.020%).
| Demographics | Rating | Rank | In Labor Force | Age 25-29 |
| Tlingit-Haida | 19.3 /100 | #197 | Poor 84.4% |
| Immigrants | Iraq | 19.0 /100 | #198 | Poor 84.4% |
| Immigrants | Germany | 18.3 /100 | #199 | Poor 84.4% |
| Immigrants | Kazakhstan | 17.5 /100 | #200 | Poor 84.4% |
| Laotians | 16.6 /100 | #201 | Poor 84.4% |
| Afghans | 15.9 /100 | #202 | Poor 84.4% |
| Immigrants | Afghanistan | 15.6 /100 | #203 | Poor 84.4% |
| Venezuelans | 15.1 /100 | #204 | Poor 84.4% |
| Ecuadorians | 14.8 /100 | #205 | Poor 84.4% |
| Immigrants | Cambodia | 14.3 /100 | #206 | Poor 84.4% |
| Immigrants | Armenia | 13.3 /100 | #207 | Poor 84.4% |
| Immigrants | Indonesia | 13.2 /100 | #208 | Poor 84.4% |
| Immigrants | Jordan | 12.8 /100 | #209 | Poor 84.4% |
| Chinese | 12.7 /100 | #210 | Poor 84.3% |
| Immigrants | Venezuela | 12.6 /100 | #211 | Poor 84.3% |