Zip Codes with the Highest Percentage of Population Employed in Agriculture, Fishing & Hunting in Utica, MI
RELATED REPORTS & OPTIONS
Agriculture, Fishing & Hunting
Utica
Compare Zip Codes
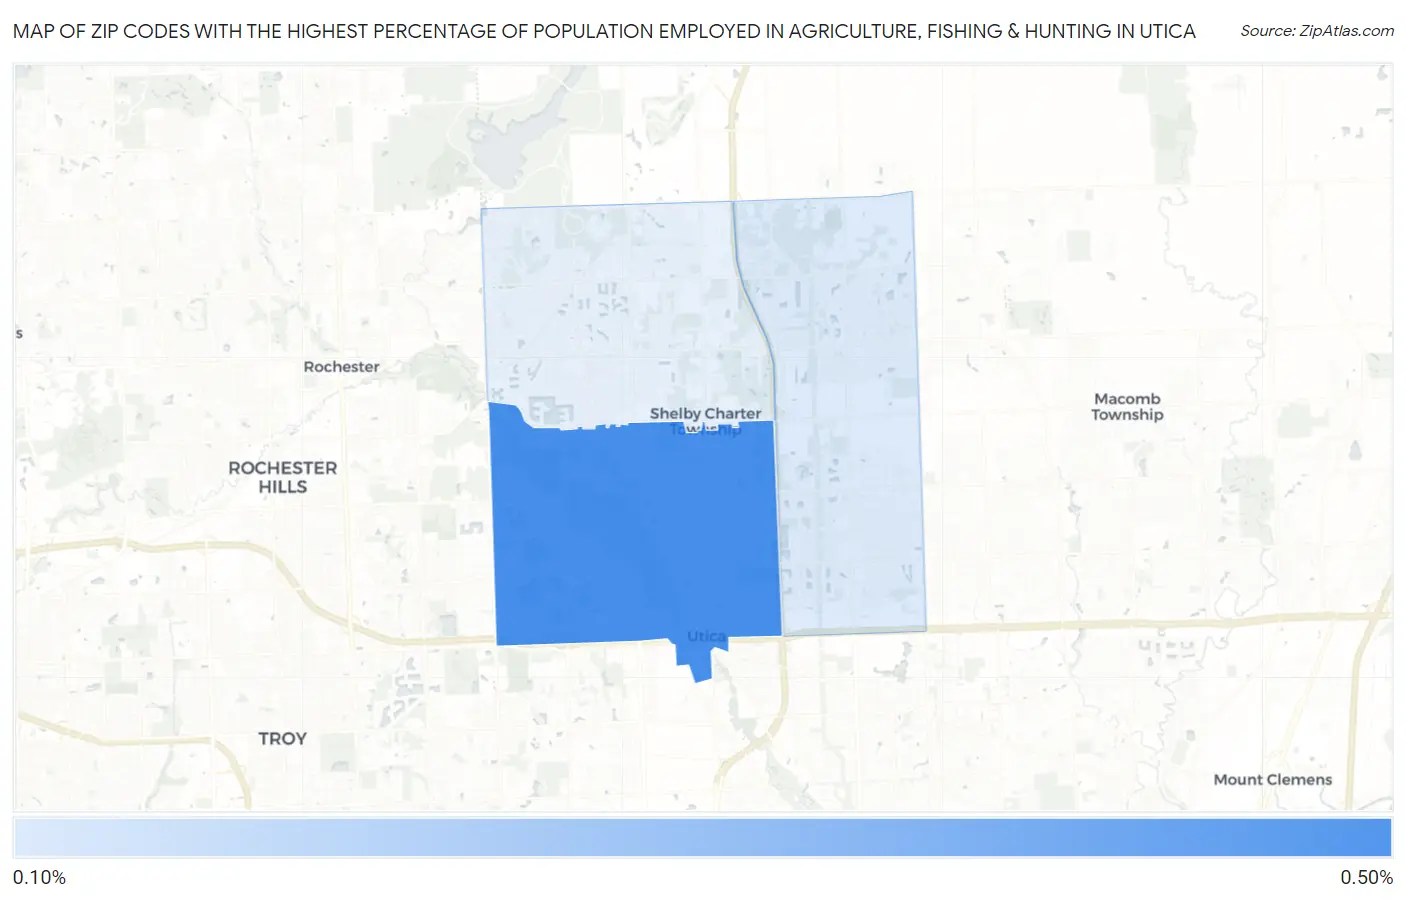
Map of Zip Codes with the Highest Percentage of Population Employed in Agriculture, Fishing & Hunting in Utica
0.18%
0.44%
Zip Codes with the Highest Percentage of Population Employed in Agriculture, Fishing & Hunting in Utica, MI
| Zip Code | % Employed | vs State | vs National | |
| 1. | 48317 | 0.44% | 0.98%(-0.545)#657 | 1.2%(-0.760)#19,803 |
| 2. | 48315 | 0.18% | 0.98%(-0.801)#752 | 1.2%(-1.02)#22,558 |
1
Common Questions
What are the Top Zip Codes with the Highest Percentage of Population Employed in Agriculture, Fishing & Hunting in Utica, MI?
Top Zip Codes with the Highest Percentage of Population Employed in Agriculture, Fishing & Hunting in Utica, MI are:
What zip code has the Highest Percentage of Population Employed in Agriculture, Fishing & Hunting in Utica, MI?
48317 has the Highest Percentage of Population Employed in Agriculture, Fishing & Hunting in Utica, MI with 0.44%.
What is the Percentage of Population Employed in Agriculture, Fishing & Hunting in Utica, MI?
Percentage of Population Employed in Agriculture, Fishing & Hunting in Utica is 0.83%.
What is the Percentage of Population Employed in Agriculture, Fishing & Hunting in Michigan?
Percentage of Population Employed in Agriculture, Fishing & Hunting in Michigan is 0.98%.
What is the Percentage of Population Employed in Agriculture, Fishing & Hunting in the United States?
Percentage of Population Employed in Agriculture, Fishing & Hunting in the United States is 1.2%.