Zip Codes with the Highest Percentage of Population Employed in Life, Physical & Social Science in Burlington, NC
RELATED REPORTS & OPTIONS
Life, Physical & Social Science
Burlington
Compare Zip Codes
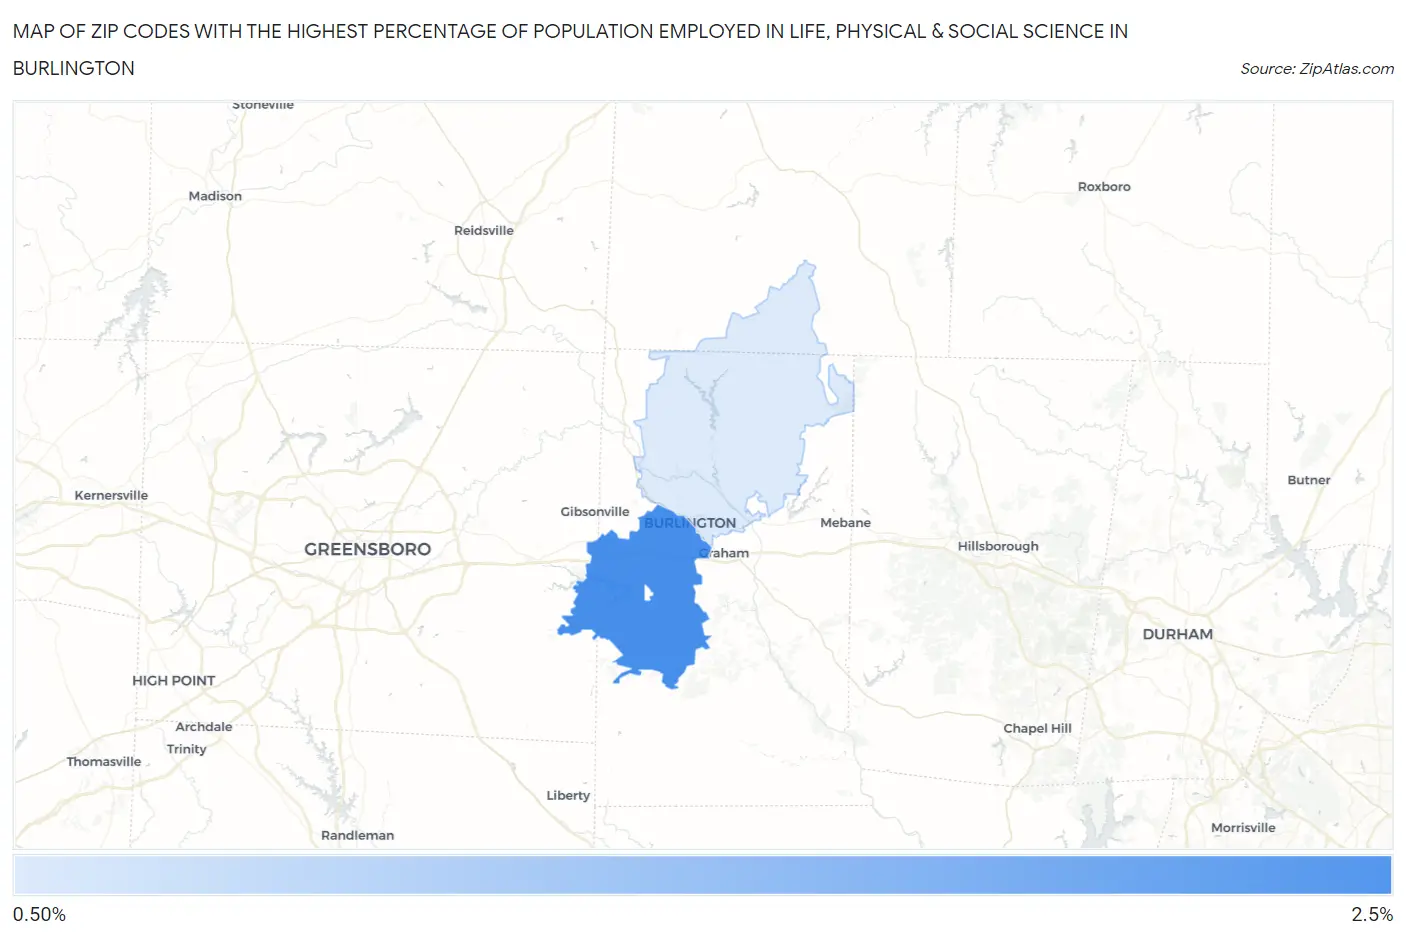
Map of Zip Codes with the Highest Percentage of Population Employed in Life, Physical & Social Science in Burlington
0.55%
2.2%
Zip Codes with the Highest Percentage of Population Employed in Life, Physical & Social Science in Burlington, NC
| Zip Code | % Employed | vs State | vs National | |
| 1. | 27215 | 2.2% | 1.1%(+1.15)#71 | 1.1%(+1.12)#3,154 |
| 2. | 27217 | 0.55% | 1.1%(-0.515)#347 | 1.1%(-0.543)#13,927 |
1
Common Questions
What are the Top Zip Codes with the Highest Percentage of Population Employed in Life, Physical & Social Science in Burlington, NC?
Top Zip Codes with the Highest Percentage of Population Employed in Life, Physical & Social Science in Burlington, NC are:
What zip code has the Highest Percentage of Population Employed in Life, Physical & Social Science in Burlington, NC?
27215 has the Highest Percentage of Population Employed in Life, Physical & Social Science in Burlington, NC with 2.2%.
What is the Percentage of Population Employed in Life, Physical & Social Science in Burlington, NC?
Percentage of Population Employed in Life, Physical & Social Science in Burlington is 1.2%.
What is the Percentage of Population Employed in Life, Physical & Social Science in North Carolina?
Percentage of Population Employed in Life, Physical & Social Science in North Carolina is 1.1%.
What is the Percentage of Population Employed in Life, Physical & Social Science in the United States?
Percentage of Population Employed in Life, Physical & Social Science in the United States is 1.1%.