Alaskan Athabascan vs Spanish Child Poverty Among Boys Under 16
COMPARE
Alaskan Athabascan
Spanish
Child Poverty Among Boys Under 16
Child Poverty Among Boys Under 16 Comparison
Alaskan Athabascans
Spanish
17.6%
CHILD POVERTY AMONG BOYS UNDER 16
7.3/ 100
METRIC RATING
209th/ 347
METRIC RANK
17.0%
CHILD POVERTY AMONG BOYS UNDER 16
20.8/ 100
METRIC RATING
195th/ 347
METRIC RANK
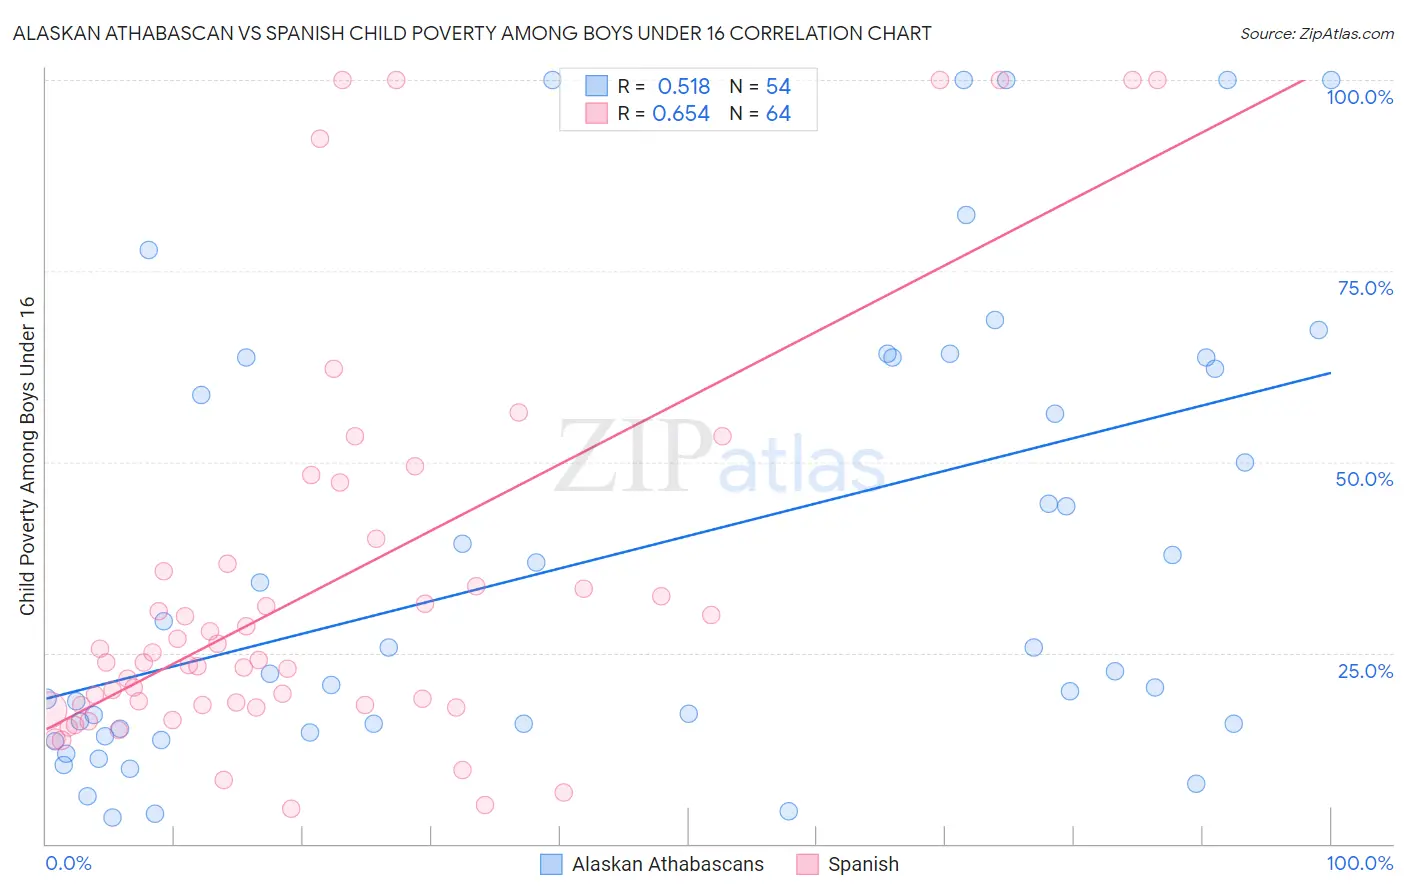
Alaskan Athabascan vs Spanish Child Poverty Among Boys Under 16 Correlation Chart
The statistical analysis conducted on geographies consisting of 45,576,006 people shows a substantial positive correlation between the proportion of Alaskan Athabascans and poverty level among boys under the age of 16 in the United States with a correlation coefficient (R) of 0.518 and weighted average of 17.6%. Similarly, the statistical analysis conducted on geographies consisting of 415,463,522 people shows a significant positive correlation between the proportion of Spanish and poverty level among boys under the age of 16 in the United States with a correlation coefficient (R) of 0.654 and weighted average of 17.0%, a difference of 3.2%.
Child Poverty Among Boys Under 16 Correlation Summary
| Measurement | Alaskan Athabascan | Spanish |
| Minimum | 3.4% | 4.6% |
| Maximum | 100.0% | 100.0% |
| Range | 96.6% | 95.4% |
| Mean | 37.8% | 33.7% |
| Median | 24.1% | 23.9% |
| Interquartile 25% (IQ1) | 15.0% | 18.2% |
| Interquartile 75% (IQ3) | 63.6% | 36.2% |
| Interquartile Range (IQR) | 48.6% | 18.0% |
| Standard Deviation (Sample) | 29.5% | 26.1% |
| Standard Deviation (Population) | 29.2% | 25.9% |
Demographics Similar to Alaskan Athabascans and Spanish by Child Poverty Among Boys Under 16
In terms of child poverty among boys under 16, the demographic groups most similar to Alaskan Athabascans are Malaysian (17.6%, a difference of 0.11%), Immigrants from Armenia (17.6%, a difference of 0.18%), Immigrants (17.6%, a difference of 0.24%), Aleut (17.7%, a difference of 0.29%), and Immigrants from Thailand (17.5%, a difference of 0.32%). Similarly, the demographic groups most similar to Spanish are Spaniard (17.1%, a difference of 0.040%), Immigrants from Lebanon (17.0%, a difference of 0.070%), Immigrants from Kenya (17.1%, a difference of 0.11%), Immigrants from Uganda (17.0%, a difference of 0.14%), and Immigrants from Iraq (17.0%, a difference of 0.14%).
| Demographics | Rating | Rank | Child Poverty Among Boys Under 16 |
| Immigrants | Uganda | 21.6 /100 | #192 | Fair 17.0% |
| Immigrants | Iraq | 21.6 /100 | #193 | Fair 17.0% |
| Immigrants | Lebanon | 21.2 /100 | #194 | Fair 17.0% |
| Spanish | 20.8 /100 | #195 | Fair 17.0% |
| Spaniards | 20.5 /100 | #196 | Fair 17.1% |
| Immigrants | Kenya | 20.1 /100 | #197 | Fair 17.1% |
| Immigrants | Cameroon | 19.0 /100 | #198 | Poor 17.1% |
| Delaware | 18.8 /100 | #199 | Poor 17.1% |
| Immigrants | Uruguay | 16.9 /100 | #200 | Poor 17.2% |
| Immigrants | Afghanistan | 13.7 /100 | #201 | Poor 17.3% |
| Immigrants | Sierra Leone | 13.4 /100 | #202 | Poor 17.3% |
| Immigrants | Uzbekistan | 13.3 /100 | #203 | Poor 17.3% |
| Ugandans | 12.5 /100 | #204 | Poor 17.3% |
| Immigrants | Portugal | 11.2 /100 | #205 | Poor 17.4% |
| German Russians | 10.9 /100 | #206 | Poor 17.4% |
| Immigrants | Thailand | 8.2 /100 | #207 | Tragic 17.5% |
| Malaysians | 7.6 /100 | #208 | Tragic 17.6% |
| Alaskan Athabascans | 7.3 /100 | #209 | Tragic 17.6% |
| Immigrants | Armenia | 6.8 /100 | #210 | Tragic 17.6% |
| Immigrants | Immigrants | 6.7 /100 | #211 | Tragic 17.6% |
| Aleuts | 6.6 /100 | #212 | Tragic 17.7% |