Aleut vs Chippewa Female Poverty Among 18-24 Year Olds
COMPARE
Aleut
Chippewa
Female Poverty Among 18-24 Year Olds
Female Poverty Among 18-24 Year Olds Comparison
Aleuts
Chippewa
20.9%
FEMALE POVERTY AMONG 18-24 YEAR OLDS
3.3/ 100
METRIC RATING
245th/ 347
METRIC RANK
25.9%
FEMALE POVERTY AMONG 18-24 YEAR OLDS
0.0/ 100
METRIC RATING
331st/ 347
METRIC RANK
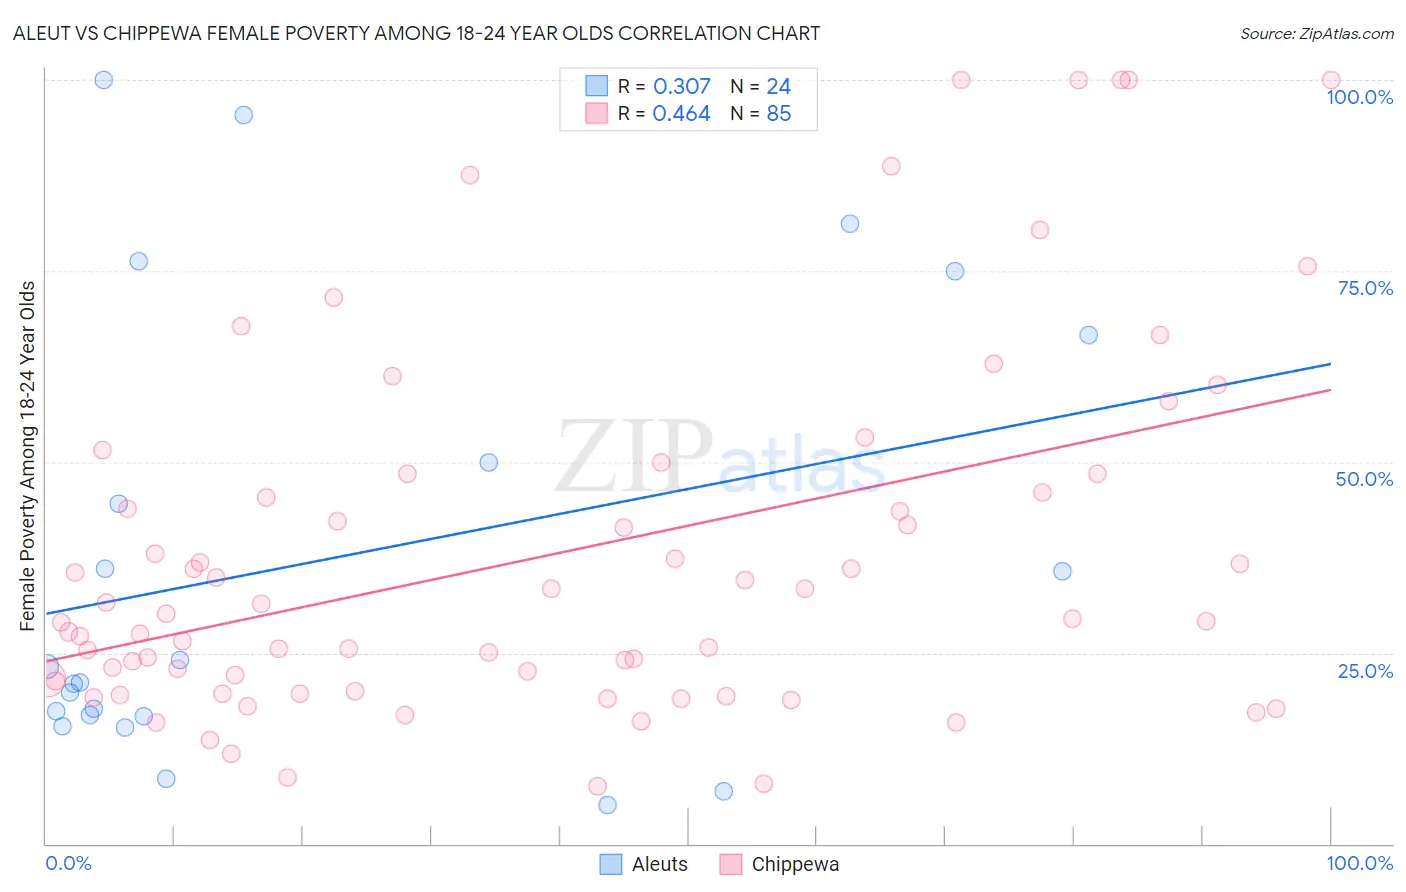
Aleut vs Chippewa Female Poverty Among 18-24 Year Olds Correlation Chart
The statistical analysis conducted on geographies consisting of 61,342,300 people shows a mild positive correlation between the proportion of Aleuts and poverty level among females between the ages 18 and 24 in the United States with a correlation coefficient (R) of 0.307 and weighted average of 20.9%. Similarly, the statistical analysis conducted on geographies consisting of 211,620,289 people shows a moderate positive correlation between the proportion of Chippewa and poverty level among females between the ages 18 and 24 in the United States with a correlation coefficient (R) of 0.464 and weighted average of 25.9%, a difference of 23.8%.
Female Poverty Among 18-24 Year Olds Correlation Summary
| Measurement | Aleut | Chippewa |
| Minimum | 5.1% | 7.5% |
| Maximum | 100.0% | 100.0% |
| Range | 94.9% | 92.5% |
| Mean | 37.1% | 37.8% |
| Median | 22.1% | 29.4% |
| Interquartile 25% (IQ1) | 16.8% | 20.7% |
| Interquartile 75% (IQ3) | 58.3% | 47.2% |
| Interquartile Range (IQR) | 41.5% | 26.5% |
| Standard Deviation (Sample) | 29.4% | 23.8% |
| Standard Deviation (Population) | 28.8% | 23.7% |
Similar Demographics by Female Poverty Among 18-24 Year Olds
Demographics Similar to Aleuts by Female Poverty Among 18-24 Year Olds
In terms of female poverty among 18-24 year olds, the demographic groups most similar to Aleuts are Immigrants from Thailand (20.9%, a difference of 0.030%), Marshallese (20.9%, a difference of 0.040%), Immigrants from Australia (20.9%, a difference of 0.080%), Immigrants from Africa (21.0%, a difference of 0.14%), and Israeli (20.9%, a difference of 0.27%).
| Demographics | Rating | Rank | Female Poverty Among 18-24 Year Olds |
| Immigrants | Singapore | 4.4 /100 | #238 | Tragic 20.9% |
| Immigrants | Guatemala | 4.3 /100 | #239 | Tragic 20.9% |
| Luxembourgers | 4.2 /100 | #240 | Tragic 20.9% |
| Immigrants | Eritrea | 4.2 /100 | #241 | Tragic 20.9% |
| Israelis | 4.1 /100 | #242 | Tragic 20.9% |
| Marshallese | 3.4 /100 | #243 | Tragic 20.9% |
| Immigrants | Thailand | 3.4 /100 | #244 | Tragic 20.9% |
| Aleuts | 3.3 /100 | #245 | Tragic 20.9% |
| Immigrants | Australia | 3.1 /100 | #246 | Tragic 20.9% |
| Immigrants | Africa | 3.0 /100 | #247 | Tragic 21.0% |
| Immigrants | Kenya | 2.5 /100 | #248 | Tragic 21.0% |
| Carpatho Rusyns | 2.5 /100 | #249 | Tragic 21.0% |
| Immigrants | West Indies | 2.2 /100 | #250 | Tragic 21.0% |
| West Indians | 1.9 /100 | #251 | Tragic 21.1% |
| South Africans | 1.6 /100 | #252 | Tragic 21.1% |
Demographics Similar to Chippewa by Female Poverty Among 18-24 Year Olds
In terms of female poverty among 18-24 year olds, the demographic groups most similar to Chippewa are Immigrants from Somalia (25.7%, a difference of 0.65%), Cajun (25.7%, a difference of 0.86%), Houma (26.2%, a difference of 1.0%), Apache (26.3%, a difference of 1.6%), and Native/Alaskan (25.4%, a difference of 2.0%).
| Demographics | Rating | Rank | Female Poverty Among 18-24 Year Olds |
| German Russians | 0.0 /100 | #324 | Tragic 25.2% |
| Immigrants | Saudi Arabia | 0.0 /100 | #325 | Tragic 25.3% |
| Yakama | 0.0 /100 | #326 | Tragic 25.3% |
| Ute | 0.0 /100 | #327 | Tragic 25.4% |
| Natives/Alaskans | 0.0 /100 | #328 | Tragic 25.4% |
| Cajuns | 0.0 /100 | #329 | Tragic 25.7% |
| Immigrants | Somalia | 0.0 /100 | #330 | Tragic 25.7% |
| Chippewa | 0.0 /100 | #331 | Tragic 25.9% |
| Houma | 0.0 /100 | #332 | Tragic 26.2% |
| Apache | 0.0 /100 | #333 | Tragic 26.3% |
| Pueblo | 0.0 /100 | #334 | Tragic 26.9% |
| Yup'ik | 0.0 /100 | #335 | Tragic 27.0% |
| Immigrants | Yemen | 0.0 /100 | #336 | Tragic 27.5% |
| Cheyenne | 0.0 /100 | #337 | Tragic 28.1% |
| Hopi | 0.0 /100 | #338 | Tragic 28.2% |