American vs Immigrants from Austria Male Poverty
COMPARE
American
Immigrants from Austria
Male Poverty
Male Poverty Comparison
Americans
Immigrants from Austria
12.1%
MALE POVERTY
3.2/ 100
METRIC RATING
212th/ 347
METRIC RANK
10.0%
MALE POVERTY
98.5/ 100
METRIC RATING
54th/ 347
METRIC RANK
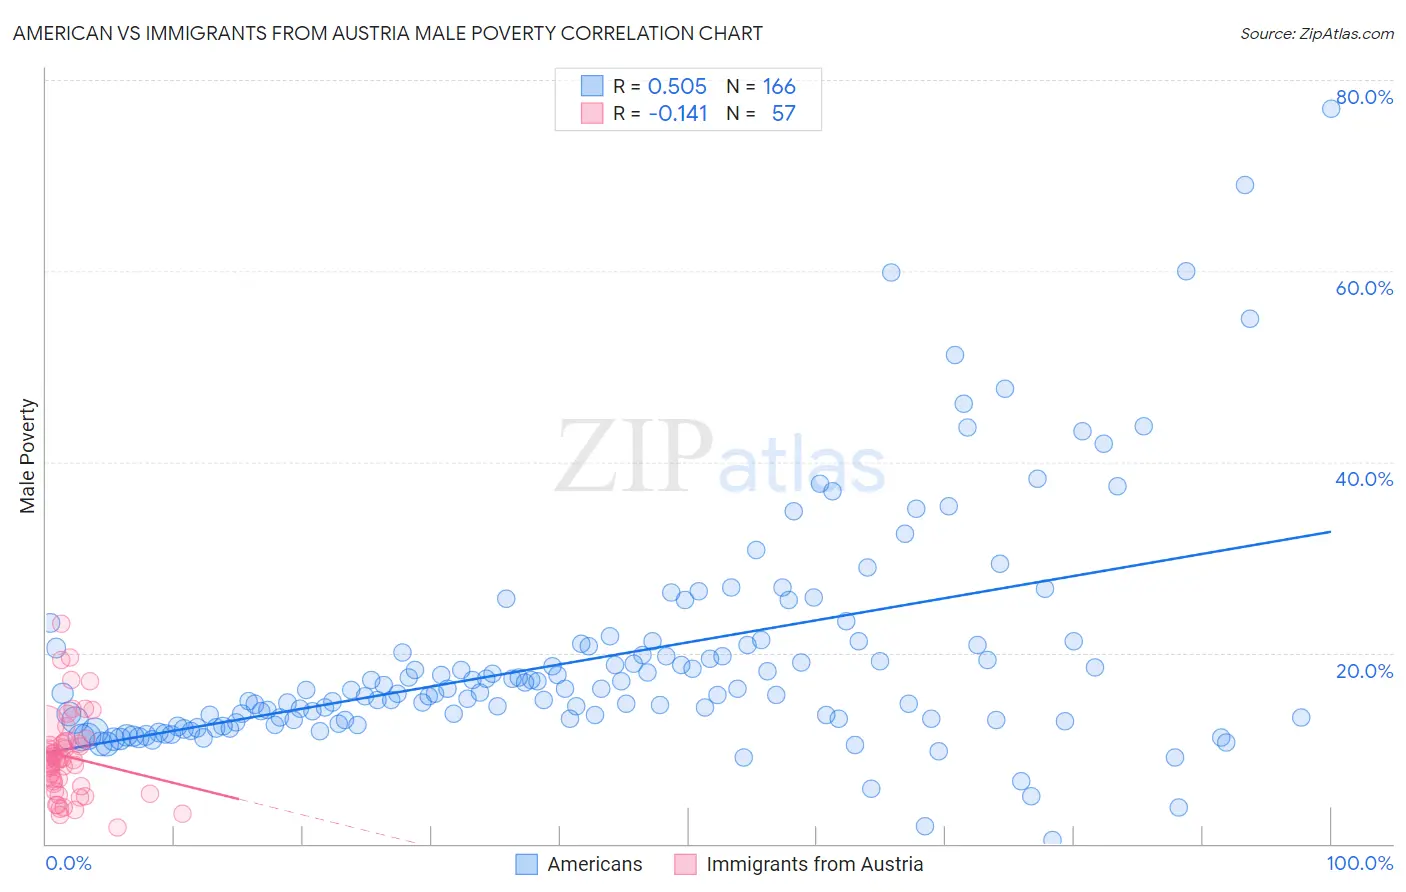
American vs Immigrants from Austria Male Poverty Correlation Chart
The statistical analysis conducted on geographies consisting of 579,982,816 people shows a substantial positive correlation between the proportion of Americans and poverty level among males in the United States with a correlation coefficient (R) of 0.505 and weighted average of 12.1%. Similarly, the statistical analysis conducted on geographies consisting of 167,922,169 people shows a poor negative correlation between the proportion of Immigrants from Austria and poverty level among males in the United States with a correlation coefficient (R) of -0.141 and weighted average of 10.0%, a difference of 20.7%.
Male Poverty Correlation Summary
| Measurement | American | Immigrants from Austria |
| Minimum | 0.36% | 1.7% |
| Maximum | 77.0% | 23.1% |
| Range | 76.7% | 21.4% |
| Mean | 19.4% | 9.1% |
| Median | 15.8% | 8.7% |
| Interquartile 25% (IQ1) | 12.9% | 6.2% |
| Interquartile 75% (IQ3) | 20.8% | 10.6% |
| Interquartile Range (IQR) | 7.9% | 4.5% |
| Standard Deviation (Sample) | 11.9% | 4.4% |
| Standard Deviation (Population) | 11.8% | 4.3% |
Similar Demographics by Male Poverty
Demographics Similar to Americans by Male Poverty
In terms of male poverty, the demographic groups most similar to Americans are Nonimmigrants (12.1%, a difference of 0.040%), Japanese (12.2%, a difference of 0.35%), Immigrants from Uzbekistan (12.2%, a difference of 0.47%), Immigrants from Cambodia (12.2%, a difference of 0.55%), and Immigrants from Panama (12.1%, a difference of 0.56%).
| Demographics | Rating | Rank | Male Poverty |
| Panamanians | 6.2 /100 | #205 | Tragic 11.9% |
| Immigrants | Eastern Africa | 5.4 /100 | #206 | Tragic 12.0% |
| Malaysians | 5.2 /100 | #207 | Tragic 12.0% |
| Immigrants | Immigrants | 4.5 /100 | #208 | Tragic 12.0% |
| Immigrants | Azores | 4.3 /100 | #209 | Tragic 12.0% |
| Moroccans | 4.2 /100 | #210 | Tragic 12.0% |
| Immigrants | Panama | 4.0 /100 | #211 | Tragic 12.1% |
| Americans | 3.2 /100 | #212 | Tragic 12.1% |
| Immigrants | Nonimmigrants | 3.1 /100 | #213 | Tragic 12.1% |
| Japanese | 2.7 /100 | #214 | Tragic 12.2% |
| Immigrants | Uzbekistan | 2.6 /100 | #215 | Tragic 12.2% |
| Immigrants | Cambodia | 2.5 /100 | #216 | Tragic 12.2% |
| Immigrants | Thailand | 2.5 /100 | #217 | Tragic 12.2% |
| German Russians | 2.5 /100 | #218 | Tragic 12.2% |
| Bermudans | 2.4 /100 | #219 | Tragic 12.2% |
Demographics Similar to Immigrants from Austria by Male Poverty
In terms of male poverty, the demographic groups most similar to Immigrants from Austria are Immigrants from Czechoslovakia (10.0%, a difference of 0.28%), German (10.1%, a difference of 0.29%), Asian (10.0%, a difference of 0.35%), Immigrants from Croatia (10.0%, a difference of 0.44%), and Immigrants from Bulgaria (10.1%, a difference of 0.50%).
| Demographics | Rating | Rank | Male Poverty |
| Immigrants | Singapore | 98.8 /100 | #47 | Exceptional 10.0% |
| Immigrants | Japan | 98.8 /100 | #48 | Exceptional 10.0% |
| Slovenes | 98.8 /100 | #49 | Exceptional 10.0% |
| Immigrants | Philippines | 98.7 /100 | #50 | Exceptional 10.0% |
| Immigrants | Croatia | 98.7 /100 | #51 | Exceptional 10.0% |
| Asians | 98.7 /100 | #52 | Exceptional 10.0% |
| Immigrants | Czechoslovakia | 98.6 /100 | #53 | Exceptional 10.0% |
| Immigrants | Austria | 98.5 /100 | #54 | Exceptional 10.0% |
| Germans | 98.3 /100 | #55 | Exceptional 10.1% |
| Immigrants | Bulgaria | 98.2 /100 | #56 | Exceptional 10.1% |
| Estonians | 98.1 /100 | #57 | Exceptional 10.1% |
| Scandinavians | 98.0 /100 | #58 | Exceptional 10.1% |
| Immigrants | Europe | 97.9 /100 | #59 | Exceptional 10.1% |
| Ukrainians | 97.9 /100 | #60 | Exceptional 10.1% |
| Austrians | 97.8 /100 | #61 | Exceptional 10.1% |