Argentinean vs Haitian Single Female Poverty
COMPARE
Argentinean
Haitian
Single Female Poverty
Single Female Poverty Comparison
Argentineans
Haitians
19.1%
SINGLE FEMALE POVERTY
99.7/ 100
METRIC RATING
54th/ 347
METRIC RANK
21.6%
SINGLE FEMALE POVERTY
15.4/ 100
METRIC RATING
208th/ 347
METRIC RANK
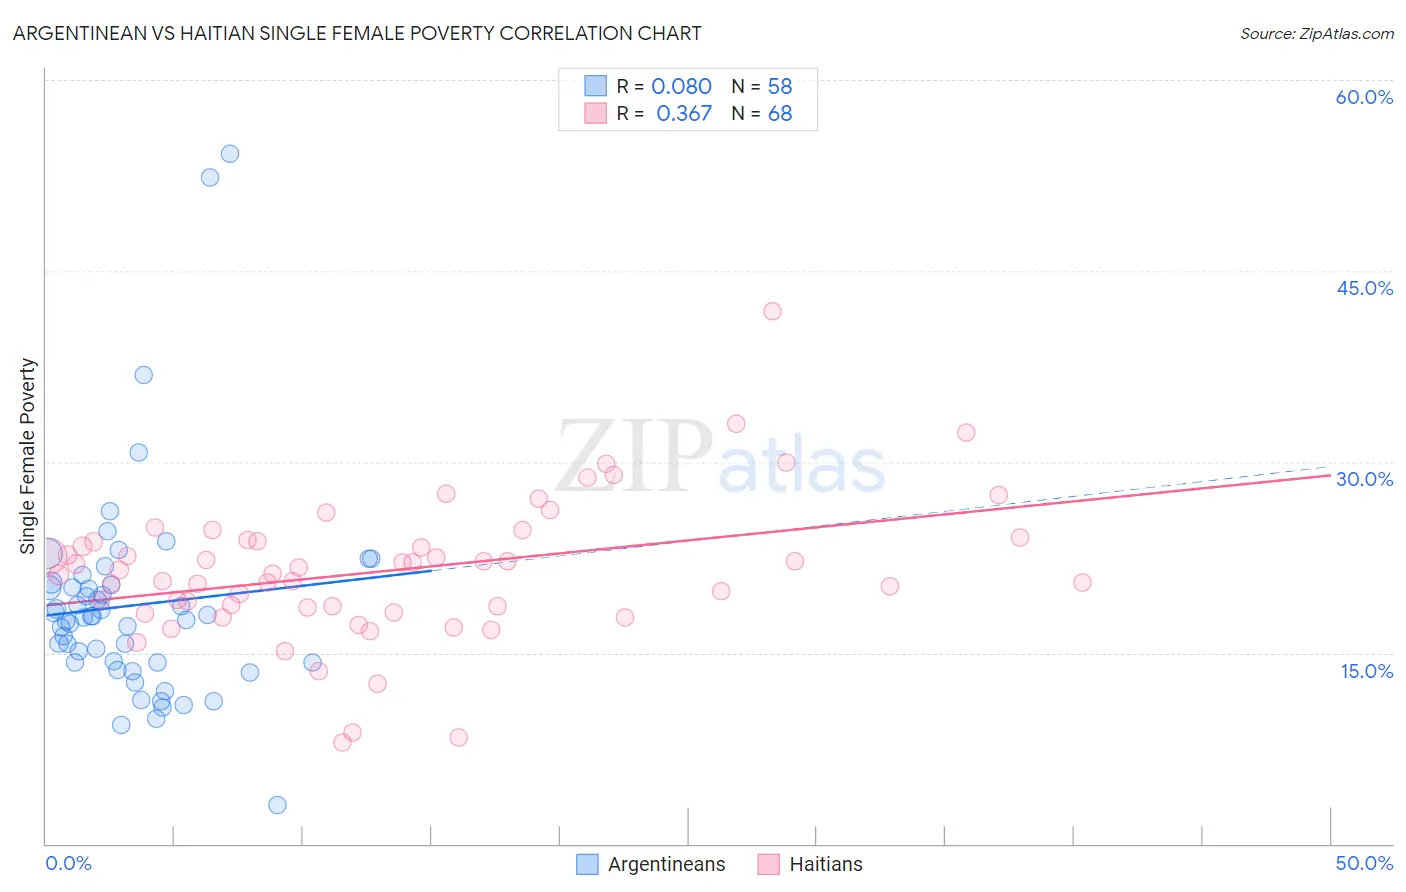
Argentinean vs Haitian Single Female Poverty Correlation Chart
The statistical analysis conducted on geographies consisting of 293,674,093 people shows a slight positive correlation between the proportion of Argentineans and poverty level among single females in the United States with a correlation coefficient (R) of 0.080 and weighted average of 19.1%. Similarly, the statistical analysis conducted on geographies consisting of 284,824,358 people shows a mild positive correlation between the proportion of Haitians and poverty level among single females in the United States with a correlation coefficient (R) of 0.367 and weighted average of 21.6%, a difference of 12.9%.
Single Female Poverty Correlation Summary
| Measurement | Argentinean | Haitian |
| Minimum | 3.0% | 7.9% |
| Maximum | 54.2% | 41.8% |
| Range | 51.2% | 33.9% |
| Mean | 18.7% | 21.5% |
| Median | 17.8% | 21.3% |
| Interquartile 25% (IQ1) | 14.2% | 18.6% |
| Interquartile 75% (IQ3) | 20.3% | 23.8% |
| Interquartile Range (IQR) | 6.1% | 5.2% |
| Standard Deviation (Sample) | 8.5% | 5.6% |
| Standard Deviation (Population) | 8.4% | 5.5% |
Similar Demographics by Single Female Poverty
Demographics Similar to Argentineans by Single Female Poverty
In terms of single female poverty, the demographic groups most similar to Argentineans are Tsimshian (19.1%, a difference of 0.010%), Immigrants from Vietnam (19.1%, a difference of 0.040%), Immigrants from Fiji (19.1%, a difference of 0.090%), Eastern European (19.1%, a difference of 0.15%), and Egyptian (19.1%, a difference of 0.22%).
| Demographics | Rating | Rank | Single Female Poverty |
| Latvians | 99.8 /100 | #47 | Exceptional 19.0% |
| Immigrants | Argentina | 99.8 /100 | #48 | Exceptional 19.0% |
| Immigrants | Czechoslovakia | 99.8 /100 | #49 | Exceptional 19.0% |
| Immigrants | Eastern Europe | 99.8 /100 | #50 | Exceptional 19.0% |
| Immigrants | Italy | 99.8 /100 | #51 | Exceptional 19.0% |
| Egyptians | 99.7 /100 | #52 | Exceptional 19.1% |
| Tsimshian | 99.7 /100 | #53 | Exceptional 19.1% |
| Argentineans | 99.7 /100 | #54 | Exceptional 19.1% |
| Immigrants | Vietnam | 99.7 /100 | #55 | Exceptional 19.1% |
| Immigrants | Fiji | 99.7 /100 | #56 | Exceptional 19.1% |
| Eastern Europeans | 99.7 /100 | #57 | Exceptional 19.1% |
| Immigrants | Bulgaria | 99.7 /100 | #58 | Exceptional 19.1% |
| Sri Lankans | 99.6 /100 | #59 | Exceptional 19.2% |
| Russians | 99.6 /100 | #60 | Exceptional 19.2% |
| Cambodians | 99.6 /100 | #61 | Exceptional 19.2% |
Demographics Similar to Haitians by Single Female Poverty
In terms of single female poverty, the demographic groups most similar to Haitians are Immigrants from Eastern Africa (21.6%, a difference of 0.030%), Ghanaian (21.6%, a difference of 0.040%), Belgian (21.5%, a difference of 0.070%), Finnish (21.5%, a difference of 0.090%), and Immigrants from Panama (21.6%, a difference of 0.12%).
| Demographics | Rating | Rank | Single Female Poverty |
| Nigerians | 20.9 /100 | #201 | Fair 21.4% |
| Immigrants | Kenya | 20.7 /100 | #202 | Fair 21.4% |
| Immigrants | Haiti | 18.8 /100 | #203 | Poor 21.5% |
| Immigrants | Africa | 16.7 /100 | #204 | Poor 21.5% |
| Finns | 16.2 /100 | #205 | Poor 21.5% |
| Belgians | 16.1 /100 | #206 | Poor 21.5% |
| Ghanaians | 15.7 /100 | #207 | Poor 21.6% |
| Haitians | 15.4 /100 | #208 | Poor 21.6% |
| Immigrants | Eastern Africa | 15.1 /100 | #209 | Poor 21.6% |
| Immigrants | Panama | 14.4 /100 | #210 | Poor 21.6% |
| Icelanders | 14.0 /100 | #211 | Poor 21.6% |
| Jamaicans | 14.0 /100 | #212 | Poor 21.6% |
| Guamanians/Chamorros | 13.7 /100 | #213 | Poor 21.6% |
| Immigrants | Nicaragua | 13.3 /100 | #214 | Poor 21.6% |
| Ecuadorians | 12.3 /100 | #215 | Poor 21.6% |