Asian vs Bahamian Single Father Poverty
COMPARE
Asian
Bahamian
Single Father Poverty
Single Father Poverty Comparison
Asians
Bahamians
14.6%
SINGLE FATHER POVERTY
100.0/ 100
METRIC RATING
32nd/ 347
METRIC RANK
18.0%
SINGLE FATHER POVERTY
0.0/ 100
METRIC RATING
288th/ 347
METRIC RANK
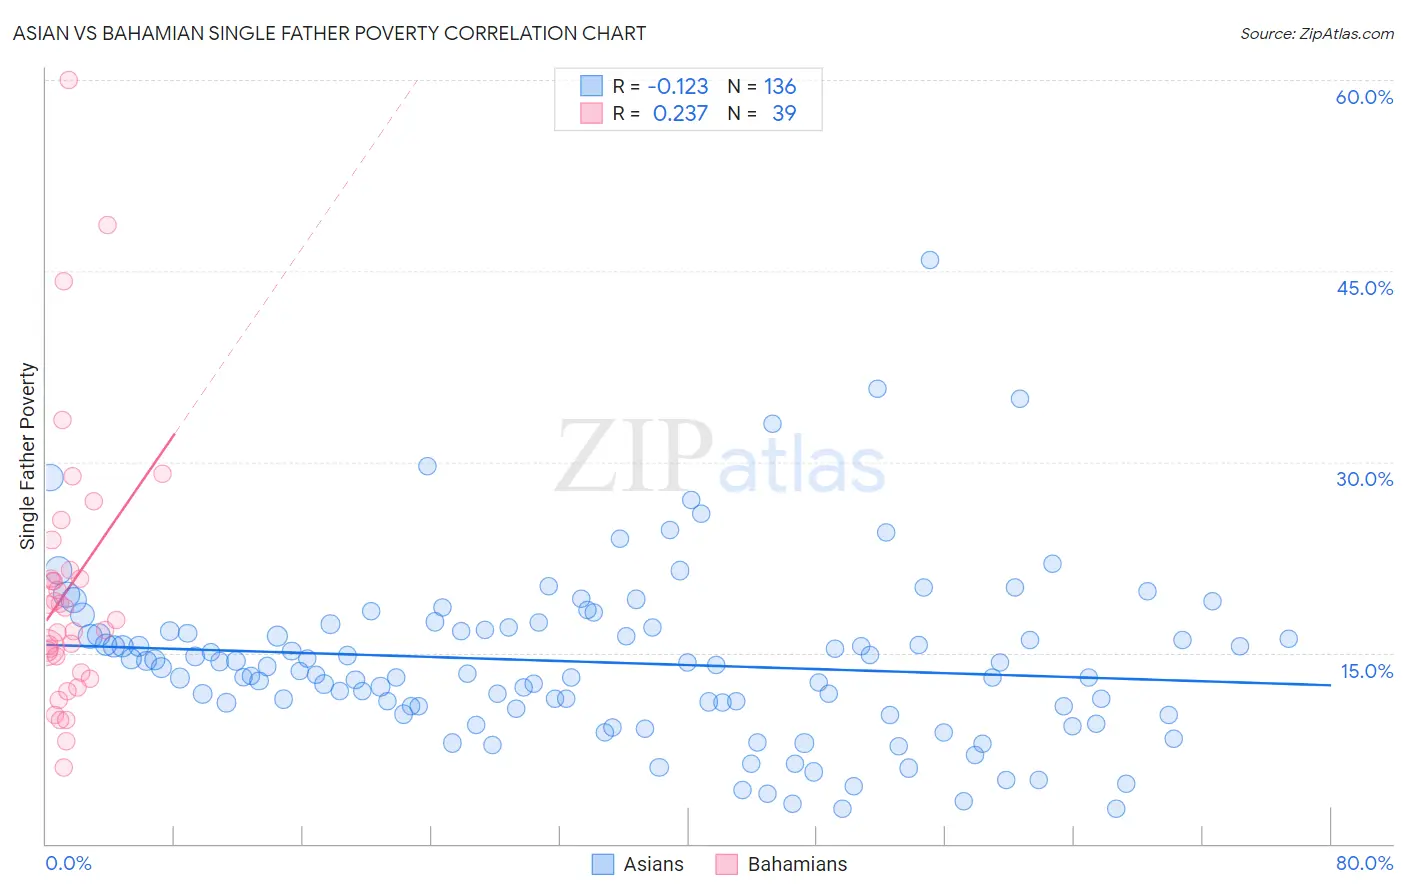
Asian vs Bahamian Single Father Poverty Correlation Chart
The statistical analysis conducted on geographies consisting of 402,614,567 people shows a poor negative correlation between the proportion of Asians and poverty level among single fathers in the United States with a correlation coefficient (R) of -0.123 and weighted average of 14.6%. Similarly, the statistical analysis conducted on geographies consisting of 102,772,098 people shows a weak positive correlation between the proportion of Bahamians and poverty level among single fathers in the United States with a correlation coefficient (R) of 0.237 and weighted average of 18.0%, a difference of 23.4%.
Single Father Poverty Correlation Summary
| Measurement | Asian | Bahamian |
| Minimum | 2.7% | 6.0% |
| Maximum | 45.8% | 60.0% |
| Range | 43.1% | 54.0% |
| Mean | 14.3% | 20.1% |
| Median | 13.7% | 17.6% |
| Interquartile 25% (IQ1) | 10.7% | 13.4% |
| Interquartile 75% (IQ3) | 16.8% | 21.5% |
| Interquartile Range (IQR) | 6.1% | 8.0% |
| Standard Deviation (Sample) | 6.7% | 10.9% |
| Standard Deviation (Population) | 6.7% | 10.8% |
Similar Demographics by Single Father Poverty
Demographics Similar to Asians by Single Father Poverty
In terms of single father poverty, the demographic groups most similar to Asians are Icelander (14.5%, a difference of 0.15%), Thai (14.5%, a difference of 0.24%), Somali (14.5%, a difference of 0.28%), Immigrants from South Central Asia (14.5%, a difference of 0.38%), and Okinawan (14.6%, a difference of 0.56%).
| Demographics | Rating | Rank | Single Father Poverty |
| Iranians | 100.0 /100 | #25 | Exceptional 14.4% |
| Spanish American Indians | 100.0 /100 | #26 | Exceptional 14.4% |
| Nepalese | 100.0 /100 | #27 | Exceptional 14.4% |
| Immigrants | South Central Asia | 100.0 /100 | #28 | Exceptional 14.5% |
| Somalis | 100.0 /100 | #29 | Exceptional 14.5% |
| Thais | 100.0 /100 | #30 | Exceptional 14.5% |
| Icelanders | 100.0 /100 | #31 | Exceptional 14.5% |
| Asians | 100.0 /100 | #32 | Exceptional 14.6% |
| Okinawans | 100.0 /100 | #33 | Exceptional 14.6% |
| Egyptians | 100.0 /100 | #34 | Exceptional 14.7% |
| Immigrants | Bolivia | 100.0 /100 | #35 | Exceptional 14.7% |
| Immigrants | Indonesia | 100.0 /100 | #36 | Exceptional 14.7% |
| Immigrants | Eastern Africa | 100.0 /100 | #37 | Exceptional 14.7% |
| Bolivians | 100.0 /100 | #38 | Exceptional 14.7% |
| Immigrants | Asia | 100.0 /100 | #39 | Exceptional 14.7% |
Demographics Similar to Bahamians by Single Father Poverty
In terms of single father poverty, the demographic groups most similar to Bahamians are Carpatho Rusyn (18.0%, a difference of 0.020%), Immigrants from North Macedonia (17.9%, a difference of 0.25%), Immigrants from Lebanon (17.9%, a difference of 0.42%), Irish (18.0%, a difference of 0.44%), and West Indian (18.0%, a difference of 0.47%).
| Demographics | Rating | Rank | Single Father Poverty |
| English | 0.0 /100 | #281 | Tragic 17.8% |
| Dutch | 0.0 /100 | #282 | Tragic 17.8% |
| Alsatians | 0.0 /100 | #283 | Tragic 17.8% |
| Welsh | 0.0 /100 | #284 | Tragic 17.8% |
| Immigrants | Lebanon | 0.0 /100 | #285 | Tragic 17.9% |
| Immigrants | North Macedonia | 0.0 /100 | #286 | Tragic 17.9% |
| Carpatho Rusyns | 0.0 /100 | #287 | Tragic 18.0% |
| Bahamians | 0.0 /100 | #288 | Tragic 18.0% |
| Irish | 0.0 /100 | #289 | Tragic 18.0% |
| West Indians | 0.0 /100 | #290 | Tragic 18.0% |
| Alaskan Athabascans | 0.0 /100 | #291 | Tragic 18.1% |
| Immigrants | Bahamas | 0.0 /100 | #292 | Tragic 18.1% |
| Alaska Natives | 0.0 /100 | #293 | Tragic 18.1% |
| U.S. Virgin Islanders | 0.0 /100 | #294 | Tragic 18.1% |
| Yakama | 0.0 /100 | #295 | Tragic 18.1% |