Assyrian/Chaldean/Syriac vs Scottish Single Female Poverty
COMPARE
Assyrian/Chaldean/Syriac
Scottish
Single Female Poverty
Single Female Poverty Comparison
Assyrians/Chaldeans/Syriacs
Scottish
17.0%
SINGLE FEMALE POVERTY
100.0/ 100
METRIC RATING
5th/ 347
METRIC RANK
21.8%
SINGLE FEMALE POVERTY
7.3/ 100
METRIC RATING
223rd/ 347
METRIC RANK
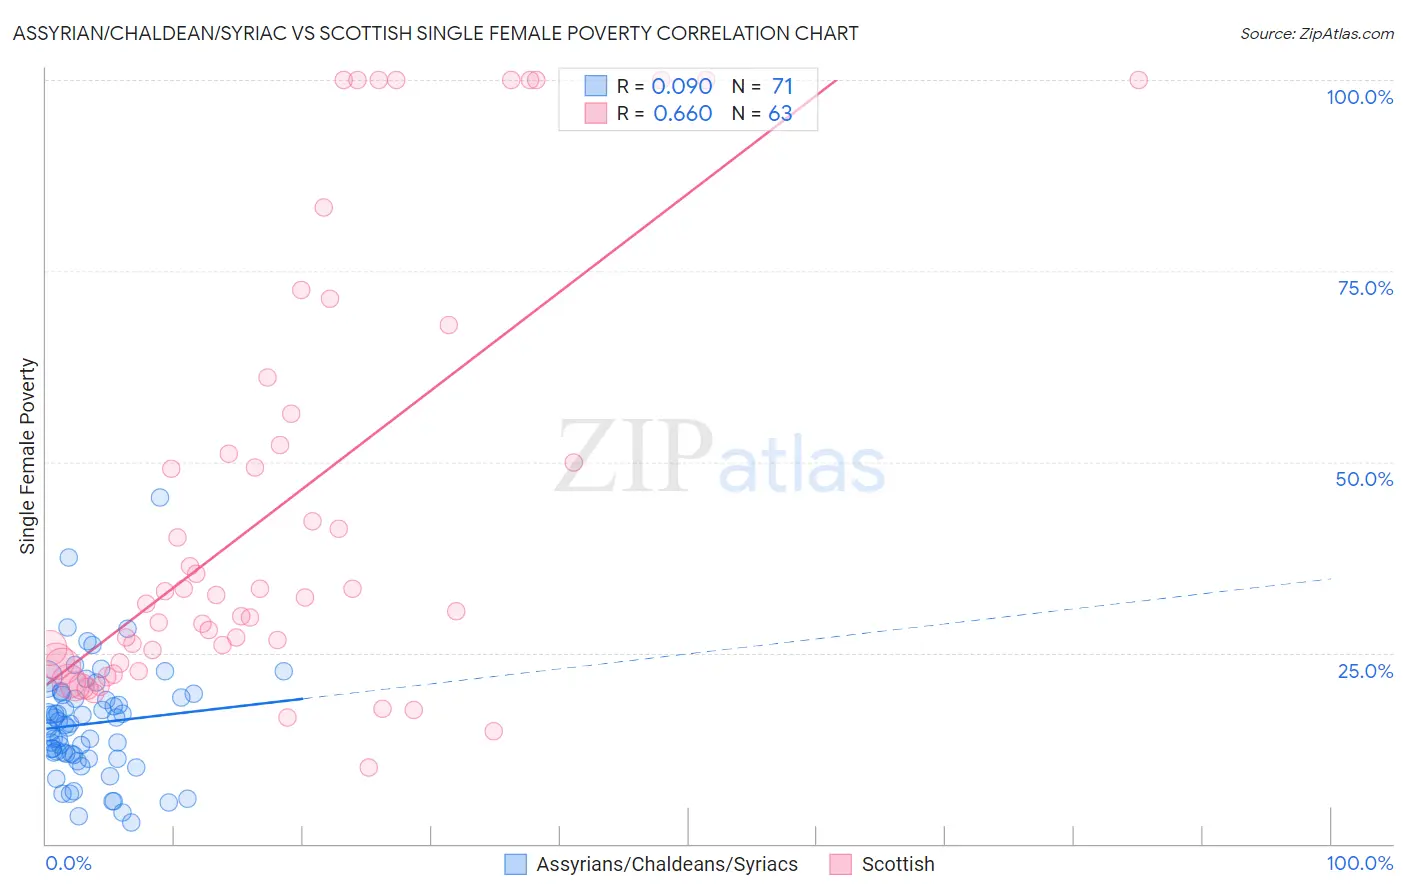
Assyrian/Chaldean/Syriac vs Scottish Single Female Poverty Correlation Chart
The statistical analysis conducted on geographies consisting of 109,756,092 people shows a slight positive correlation between the proportion of Assyrians/Chaldeans/Syriacs and poverty level among single females in the United States with a correlation coefficient (R) of 0.090 and weighted average of 17.0%. Similarly, the statistical analysis conducted on geographies consisting of 546,834,351 people shows a significant positive correlation between the proportion of Scottish and poverty level among single females in the United States with a correlation coefficient (R) of 0.660 and weighted average of 21.8%, a difference of 28.8%.
Single Female Poverty Correlation Summary
| Measurement | Assyrian/Chaldean/Syriac | Scottish |
| Minimum | 2.7% | 10.0% |
| Maximum | 45.3% | 100.0% |
| Range | 42.5% | 90.0% |
| Mean | 15.7% | 44.2% |
| Median | 15.6% | 32.2% |
| Interquartile 25% (IQ1) | 11.7% | 23.7% |
| Interquartile 75% (IQ3) | 19.6% | 56.2% |
| Interquartile Range (IQR) | 7.9% | 32.6% |
| Standard Deviation (Sample) | 7.4% | 28.5% |
| Standard Deviation (Population) | 7.3% | 28.3% |
Similar Demographics by Single Female Poverty
Demographics Similar to Assyrians/Chaldeans/Syriacs by Single Female Poverty
In terms of single female poverty, the demographic groups most similar to Assyrians/Chaldeans/Syriacs are Filipino (17.0%, a difference of 0.20%), Immigrants from India (16.8%, a difference of 0.83%), Thai (17.3%, a difference of 1.9%), Immigrants from Hong Kong (16.5%, a difference of 2.6%), and Immigrants from Iran (17.5%, a difference of 3.0%).
| Demographics | Rating | Rank | Single Female Poverty |
| Chinese | 100.0 /100 | #1 | Exceptional 16.1% |
| Immigrants | Taiwan | 100.0 /100 | #2 | Exceptional 16.4% |
| Immigrants | Hong Kong | 100.0 /100 | #3 | Exceptional 16.5% |
| Immigrants | India | 100.0 /100 | #4 | Exceptional 16.8% |
| Assyrians/Chaldeans/Syriacs | 100.0 /100 | #5 | Exceptional 17.0% |
| Filipinos | 100.0 /100 | #6 | Exceptional 17.0% |
| Thais | 100.0 /100 | #7 | Exceptional 17.3% |
| Immigrants | Iran | 100.0 /100 | #8 | Exceptional 17.5% |
| Bhutanese | 100.0 /100 | #9 | Exceptional 17.7% |
| Immigrants | Ireland | 100.0 /100 | #10 | Exceptional 17.8% |
| Immigrants | Lithuania | 100.0 /100 | #11 | Exceptional 17.8% |
| Immigrants | South Central Asia | 100.0 /100 | #12 | Exceptional 17.8% |
| Immigrants | Bolivia | 100.0 /100 | #13 | Exceptional 17.8% |
| Bolivians | 100.0 /100 | #14 | Exceptional 17.9% |
| Indians (Asian) | 100.0 /100 | #15 | Exceptional 17.9% |
Demographics Similar to Scottish by Single Female Poverty
In terms of single female poverty, the demographic groups most similar to Scottish are Barbadian (21.8%, a difference of 0.020%), Immigrants from Eritrea (21.8%, a difference of 0.14%), Immigrants from Grenada (21.8%, a difference of 0.15%), English (21.9%, a difference of 0.20%), and German (21.8%, a difference of 0.21%).
| Demographics | Rating | Rank | Single Female Poverty |
| Immigrants | Barbados | 12.2 /100 | #216 | Poor 21.7% |
| Immigrants | St. Vincent and the Grenadines | 11.7 /100 | #217 | Poor 21.7% |
| Nepalese | 9.7 /100 | #218 | Tragic 21.7% |
| Panamanians | 9.4 /100 | #219 | Tragic 21.7% |
| Germans | 8.3 /100 | #220 | Tragic 21.8% |
| Immigrants | Grenada | 8.0 /100 | #221 | Tragic 21.8% |
| Immigrants | Eritrea | 7.9 /100 | #222 | Tragic 21.8% |
| Scottish | 7.3 /100 | #223 | Tragic 21.8% |
| Barbadians | 7.2 /100 | #224 | Tragic 21.8% |
| English | 6.4 /100 | #225 | Tragic 21.9% |
| Immigrants | Portugal | 5.8 /100 | #226 | Tragic 21.9% |
| Immigrants | Ghana | 5.8 /100 | #227 | Tragic 21.9% |
| Salvadorans | 5.5 /100 | #228 | Tragic 21.9% |
| Tlingit-Haida | 5.4 /100 | #229 | Tragic 21.9% |
| Immigrants | Western Africa | 5.3 /100 | #230 | Tragic 22.0% |