Belizean vs Iraqi Poverty
COMPARE
Belizean
Iraqi
Poverty
Poverty Comparison
Belizeans
Iraqis
14.8%
POVERTY
0.0/ 100
METRIC RATING
278th/ 347
METRIC RANK
12.7%
POVERTY
20.8/ 100
METRIC RATING
196th/ 347
METRIC RANK
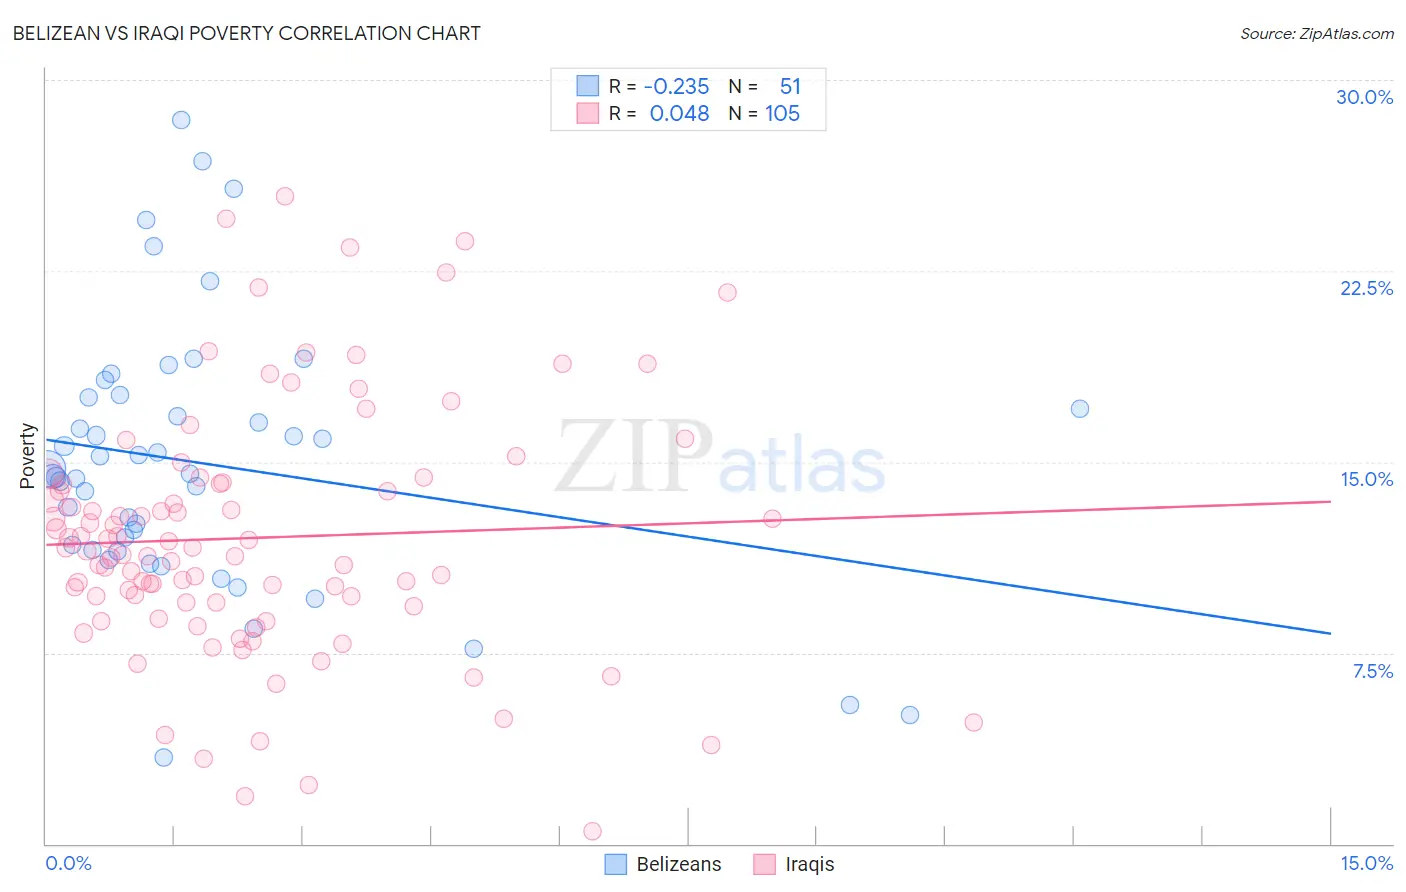
Belizean vs Iraqi Poverty Correlation Chart
The statistical analysis conducted on geographies consisting of 144,164,069 people shows a weak negative correlation between the proportion of Belizeans and poverty level in the United States with a correlation coefficient (R) of -0.235 and weighted average of 14.8%. Similarly, the statistical analysis conducted on geographies consisting of 170,596,700 people shows no correlation between the proportion of Iraqis and poverty level in the United States with a correlation coefficient (R) of 0.048 and weighted average of 12.7%, a difference of 16.5%.
Poverty Correlation Summary
| Measurement | Belizean | Iraqi |
| Minimum | 3.4% | 0.47% |
| Maximum | 28.4% | 25.4% |
| Range | 25.0% | 25.0% |
| Mean | 14.9% | 12.0% |
| Median | 14.5% | 11.5% |
| Interquartile 25% (IQ1) | 11.5% | 9.4% |
| Interquartile 75% (IQ3) | 17.5% | 14.2% |
| Interquartile Range (IQR) | 6.0% | 4.8% |
| Standard Deviation (Sample) | 5.2% | 4.9% |
| Standard Deviation (Population) | 5.2% | 4.9% |
Similar Demographics by Poverty
Demographics Similar to Belizeans by Poverty
In terms of poverty, the demographic groups most similar to Belizeans are Bangladeshi (14.8%, a difference of 0.020%), Immigrants from Bahamas (14.8%, a difference of 0.070%), Immigrants from West Indies (14.8%, a difference of 0.080%), Barbadian (14.8%, a difference of 0.11%), and Immigrants from St. Vincent and the Grenadines (14.9%, a difference of 0.29%).
| Demographics | Rating | Rank | Poverty |
| Shoshone | 0.0 /100 | #271 | Tragic 14.7% |
| Chickasaw | 0.0 /100 | #272 | Tragic 14.7% |
| Spanish Americans | 0.0 /100 | #273 | Tragic 14.7% |
| Barbadians | 0.0 /100 | #274 | Tragic 14.8% |
| Immigrants | West Indies | 0.0 /100 | #275 | Tragic 14.8% |
| Immigrants | Bahamas | 0.0 /100 | #276 | Tragic 14.8% |
| Bangladeshis | 0.0 /100 | #277 | Tragic 14.8% |
| Belizeans | 0.0 /100 | #278 | Tragic 14.8% |
| Immigrants | St. Vincent and the Grenadines | 0.0 /100 | #279 | Tragic 14.9% |
| Haitians | 0.0 /100 | #280 | Tragic 14.9% |
| Immigrants | Barbados | 0.0 /100 | #281 | Tragic 14.9% |
| Comanche | 0.0 /100 | #282 | Tragic 15.0% |
| Immigrants | Haiti | 0.0 /100 | #283 | Tragic 15.0% |
| West Indians | 0.0 /100 | #284 | Tragic 15.0% |
| Vietnamese | 0.0 /100 | #285 | Tragic 15.0% |
Demographics Similar to Iraqis by Poverty
In terms of poverty, the demographic groups most similar to Iraqis are Immigrants from Kuwait (12.7%, a difference of 0.020%), Arab (12.7%, a difference of 0.050%), Delaware (12.7%, a difference of 0.090%), Immigrants from Lebanon (12.8%, a difference of 0.31%), and Spanish (12.8%, a difference of 0.31%).
| Demographics | Rating | Rank | Poverty |
| Aleuts | 33.2 /100 | #189 | Fair 12.5% |
| Immigrants | South America | 32.3 /100 | #190 | Fair 12.5% |
| Sierra Leoneans | 31.5 /100 | #191 | Fair 12.6% |
| South American Indians | 23.3 /100 | #192 | Fair 12.7% |
| Delaware | 21.4 /100 | #193 | Fair 12.7% |
| Arabs | 21.1 /100 | #194 | Fair 12.7% |
| Immigrants | Kuwait | 20.9 /100 | #195 | Fair 12.7% |
| Iraqis | 20.8 /100 | #196 | Fair 12.7% |
| Immigrants | Lebanon | 18.7 /100 | #197 | Poor 12.8% |
| Spanish | 18.7 /100 | #198 | Poor 12.8% |
| Immigrants | Kenya | 17.5 /100 | #199 | Poor 12.8% |
| Spaniards | 16.5 /100 | #200 | Poor 12.8% |
| Immigrants | Uganda | 16.5 /100 | #201 | Poor 12.8% |
| Immigrants | Uruguay | 15.6 /100 | #202 | Poor 12.8% |
| Hmong | 15.0 /100 | #203 | Poor 12.8% |