Bolivian vs Luxembourger Single Mother Poverty
COMPARE
Bolivian
Luxembourger
Single Mother Poverty
Single Mother Poverty Comparison
Bolivians
Luxembourgers
25.9%
SINGLE MOTHER POVERTY
100.0/ 100
METRIC RATING
16th/ 347
METRIC RANK
28.5%
SINGLE MOTHER POVERTY
86.4/ 100
METRIC RATING
144th/ 347
METRIC RANK
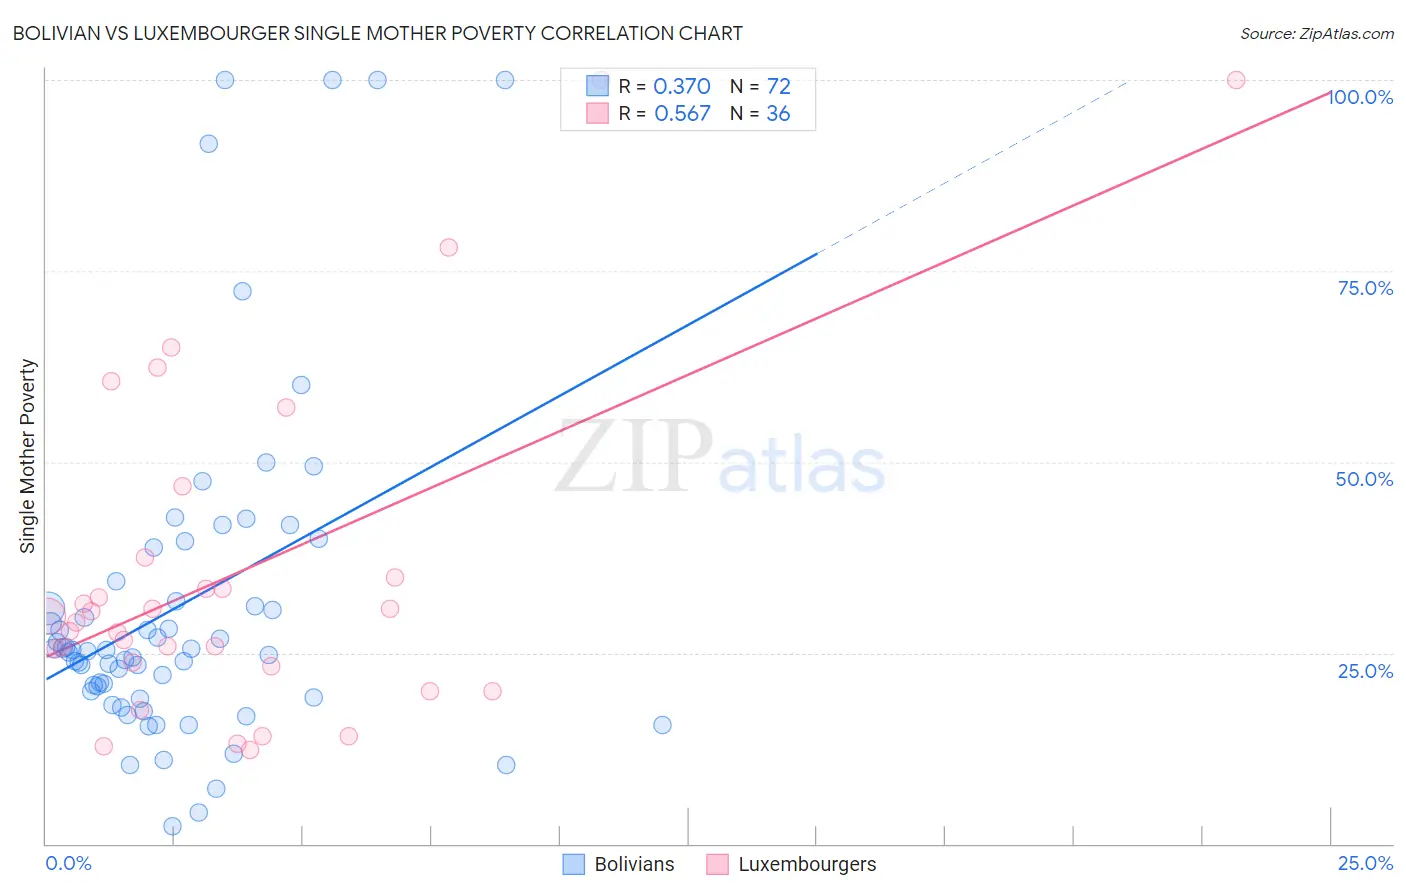
Bolivian vs Luxembourger Single Mother Poverty Correlation Chart
The statistical analysis conducted on geographies consisting of 182,525,301 people shows a mild positive correlation between the proportion of Bolivians and poverty level among single mothers in the United States with a correlation coefficient (R) of 0.370 and weighted average of 25.9%. Similarly, the statistical analysis conducted on geographies consisting of 142,536,891 people shows a substantial positive correlation between the proportion of Luxembourgers and poverty level among single mothers in the United States with a correlation coefficient (R) of 0.567 and weighted average of 28.5%, a difference of 10.1%.
Single Mother Poverty Correlation Summary
| Measurement | Bolivian | Luxembourger |
| Minimum | 2.2% | 12.2% |
| Maximum | 100.0% | 100.0% |
| Range | 97.8% | 87.8% |
| Mean | 31.3% | 35.5% |
| Median | 25.3% | 29.4% |
| Interquartile 25% (IQ1) | 19.6% | 23.5% |
| Interquartile 75% (IQ3) | 33.1% | 36.2% |
| Interquartile Range (IQR) | 13.5% | 12.7% |
| Standard Deviation (Sample) | 22.0% | 22.2% |
| Standard Deviation (Population) | 21.8% | 21.9% |
Similar Demographics by Single Mother Poverty
Demographics Similar to Bolivians by Single Mother Poverty
In terms of single mother poverty, the demographic groups most similar to Bolivians are Asian (26.0%, a difference of 0.18%), Immigrants from Ireland (25.8%, a difference of 0.29%), Immigrants from Pakistan (26.0%, a difference of 0.46%), Immigrants from Singapore (25.8%, a difference of 0.47%), and Immigrants from Eastern Asia (26.1%, a difference of 0.61%).
| Demographics | Rating | Rank | Single Mother Poverty |
| Immigrants | Lithuania | 100.0 /100 | #9 | Exceptional 25.2% |
| Immigrants | South Central Asia | 100.0 /100 | #10 | Exceptional 25.3% |
| Iranians | 100.0 /100 | #11 | Exceptional 25.5% |
| Bhutanese | 100.0 /100 | #12 | Exceptional 25.6% |
| Indians (Asian) | 100.0 /100 | #13 | Exceptional 25.8% |
| Immigrants | Singapore | 100.0 /100 | #14 | Exceptional 25.8% |
| Immigrants | Ireland | 100.0 /100 | #15 | Exceptional 25.8% |
| Bolivians | 100.0 /100 | #16 | Exceptional 25.9% |
| Asians | 100.0 /100 | #17 | Exceptional 26.0% |
| Immigrants | Pakistan | 100.0 /100 | #18 | Exceptional 26.0% |
| Immigrants | Eastern Asia | 100.0 /100 | #19 | Exceptional 26.1% |
| Immigrants | China | 100.0 /100 | #20 | Exceptional 26.1% |
| Immigrants | Bolivia | 100.0 /100 | #21 | Exceptional 26.2% |
| Immigrants | Korea | 100.0 /100 | #22 | Exceptional 26.2% |
| Burmese | 100.0 /100 | #23 | Exceptional 26.2% |
Demographics Similar to Luxembourgers by Single Mother Poverty
In terms of single mother poverty, the demographic groups most similar to Luxembourgers are Immigrants from North America (28.5%, a difference of 0.010%), South African (28.5%, a difference of 0.020%), Immigrants from South America (28.5%, a difference of 0.030%), Immigrants from Denmark (28.5%, a difference of 0.040%), and Danish (28.5%, a difference of 0.070%).
| Demographics | Rating | Rank | Single Mother Poverty |
| Immigrants | Canada | 88.9 /100 | #137 | Excellent 28.4% |
| Immigrants | Belgium | 88.5 /100 | #138 | Excellent 28.5% |
| Samoans | 88.1 /100 | #139 | Excellent 28.5% |
| Immigrants | Colombia | 88.0 /100 | #140 | Excellent 28.5% |
| Danes | 87.1 /100 | #141 | Excellent 28.5% |
| South Africans | 86.6 /100 | #142 | Excellent 28.5% |
| Immigrants | North America | 86.5 /100 | #143 | Excellent 28.5% |
| Luxembourgers | 86.4 /100 | #144 | Excellent 28.5% |
| Immigrants | South America | 86.1 /100 | #145 | Excellent 28.5% |
| Immigrants | Denmark | 86.1 /100 | #146 | Excellent 28.5% |
| Immigrants | Lebanon | 85.3 /100 | #147 | Excellent 28.6% |
| Syrians | 85.3 /100 | #148 | Excellent 28.6% |
| Serbians | 85.0 /100 | #149 | Excellent 28.6% |
| Northern Europeans | 81.7 /100 | #150 | Excellent 28.6% |
| Immigrants | Oceania | 79.9 /100 | #151 | Good 28.7% |