Bolivian vs Ute Child Poverty Among Girls Under 16
COMPARE
Bolivian
Ute
Child Poverty Among Girls Under 16
Child Poverty Among Girls Under 16 Comparison
Bolivians
Ute
13.6%
CHILD POVERTY AMONG GIRLS UNDER 16
99.8/ 100
METRIC RATING
29th/ 347
METRIC RANK
21.8%
CHILD POVERTY AMONG GIRLS UNDER 16
0.0/ 100
METRIC RATING
315th/ 347
METRIC RANK
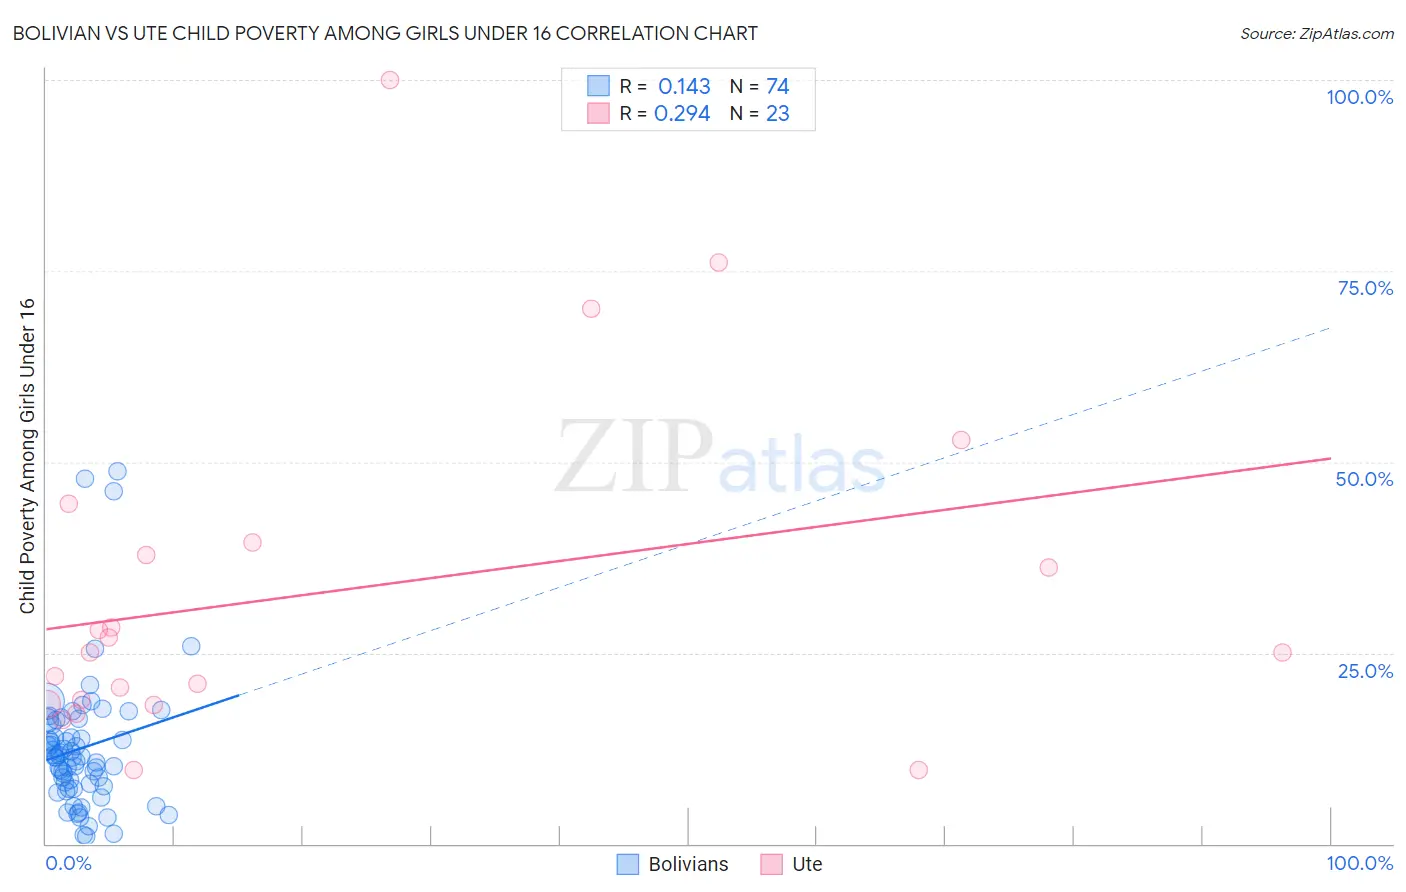
Bolivian vs Ute Child Poverty Among Girls Under 16 Correlation Chart
The statistical analysis conducted on geographies consisting of 183,239,714 people shows a poor positive correlation between the proportion of Bolivians and poverty level among girls under the age of 16 in the United States with a correlation coefficient (R) of 0.143 and weighted average of 13.6%. Similarly, the statistical analysis conducted on geographies consisting of 55,563,406 people shows a weak positive correlation between the proportion of Ute and poverty level among girls under the age of 16 in the United States with a correlation coefficient (R) of 0.294 and weighted average of 21.8%, a difference of 60.5%.
Child Poverty Among Girls Under 16 Correlation Summary
| Measurement | Bolivian | Ute |
| Minimum | 1.0% | 9.6% |
| Maximum | 48.7% | 100.0% |
| Range | 47.7% | 90.4% |
| Mean | 12.5% | 33.1% |
| Median | 11.3% | 25.0% |
| Interquartile 25% (IQ1) | 7.5% | 18.3% |
| Interquartile 75% (IQ3) | 15.5% | 39.5% |
| Interquartile Range (IQR) | 8.1% | 21.2% |
| Standard Deviation (Sample) | 9.0% | 22.6% |
| Standard Deviation (Population) | 8.9% | 22.1% |
Similar Demographics by Child Poverty Among Girls Under 16
Demographics Similar to Bolivians by Child Poverty Among Girls Under 16
In terms of child poverty among girls under 16, the demographic groups most similar to Bolivians are Tongan (13.6%, a difference of 0.12%), Latvian (13.5%, a difference of 0.38%), Eastern European (13.5%, a difference of 0.40%), Asian (13.7%, a difference of 0.67%), and Turkish (13.7%, a difference of 0.79%).
| Demographics | Rating | Rank | Child Poverty Among Girls Under 16 |
| Indians (Asian) | 99.9 /100 | #22 | Exceptional 13.3% |
| Norwegians | 99.9 /100 | #23 | Exceptional 13.3% |
| Immigrants | Eastern Asia | 99.9 /100 | #24 | Exceptional 13.4% |
| Immigrants | China | 99.8 /100 | #25 | Exceptional 13.4% |
| Eastern Europeans | 99.8 /100 | #26 | Exceptional 13.5% |
| Latvians | 99.8 /100 | #27 | Exceptional 13.5% |
| Tongans | 99.8 /100 | #28 | Exceptional 13.6% |
| Bolivians | 99.8 /100 | #29 | Exceptional 13.6% |
| Asians | 99.7 /100 | #30 | Exceptional 13.7% |
| Turks | 99.7 /100 | #31 | Exceptional 13.7% |
| Danes | 99.7 /100 | #32 | Exceptional 13.7% |
| Swedes | 99.7 /100 | #33 | Exceptional 13.7% |
| Maltese | 99.7 /100 | #34 | Exceptional 13.7% |
| Immigrants | Northern Europe | 99.6 /100 | #35 | Exceptional 13.8% |
| Russians | 99.6 /100 | #36 | Exceptional 13.9% |
Demographics Similar to Ute by Child Poverty Among Girls Under 16
In terms of child poverty among girls under 16, the demographic groups most similar to Ute are Immigrants from Guatemala (21.9%, a difference of 0.27%), Arapaho (21.7%, a difference of 0.28%), Creek (21.7%, a difference of 0.29%), African (21.9%, a difference of 0.59%), and Immigrants from Mexico (21.6%, a difference of 0.80%).
| Demographics | Rating | Rank | Child Poverty Among Girls Under 16 |
| Houma | 0.0 /100 | #308 | Tragic 21.5% |
| Bahamians | 0.0 /100 | #309 | Tragic 21.5% |
| Immigrants | Somalia | 0.0 /100 | #310 | Tragic 21.6% |
| Dutch West Indians | 0.0 /100 | #311 | Tragic 21.6% |
| Immigrants | Mexico | 0.0 /100 | #312 | Tragic 21.6% |
| Creek | 0.0 /100 | #313 | Tragic 21.7% |
| Arapaho | 0.0 /100 | #314 | Tragic 21.7% |
| Ute | 0.0 /100 | #315 | Tragic 21.8% |
| Immigrants | Guatemala | 0.0 /100 | #316 | Tragic 21.9% |
| Africans | 0.0 /100 | #317 | Tragic 21.9% |
| Immigrants | Dominica | 0.0 /100 | #318 | Tragic 22.1% |
| U.S. Virgin Islanders | 0.0 /100 | #319 | Tragic 22.1% |
| Hondurans | 0.0 /100 | #320 | Tragic 22.2% |
| Colville | 0.0 /100 | #321 | Tragic 22.5% |
| Yakama | 0.0 /100 | #322 | Tragic 22.6% |