Burmese vs Egyptian Poverty
COMPARE
Burmese
Egyptian
Poverty
Poverty Comparison
Burmese
Egyptians
10.7%
POVERTY
99.6/ 100
METRIC RATING
26th/ 347
METRIC RANK
11.3%
POVERTY
96.5/ 100
METRIC RATING
82nd/ 347
METRIC RANK
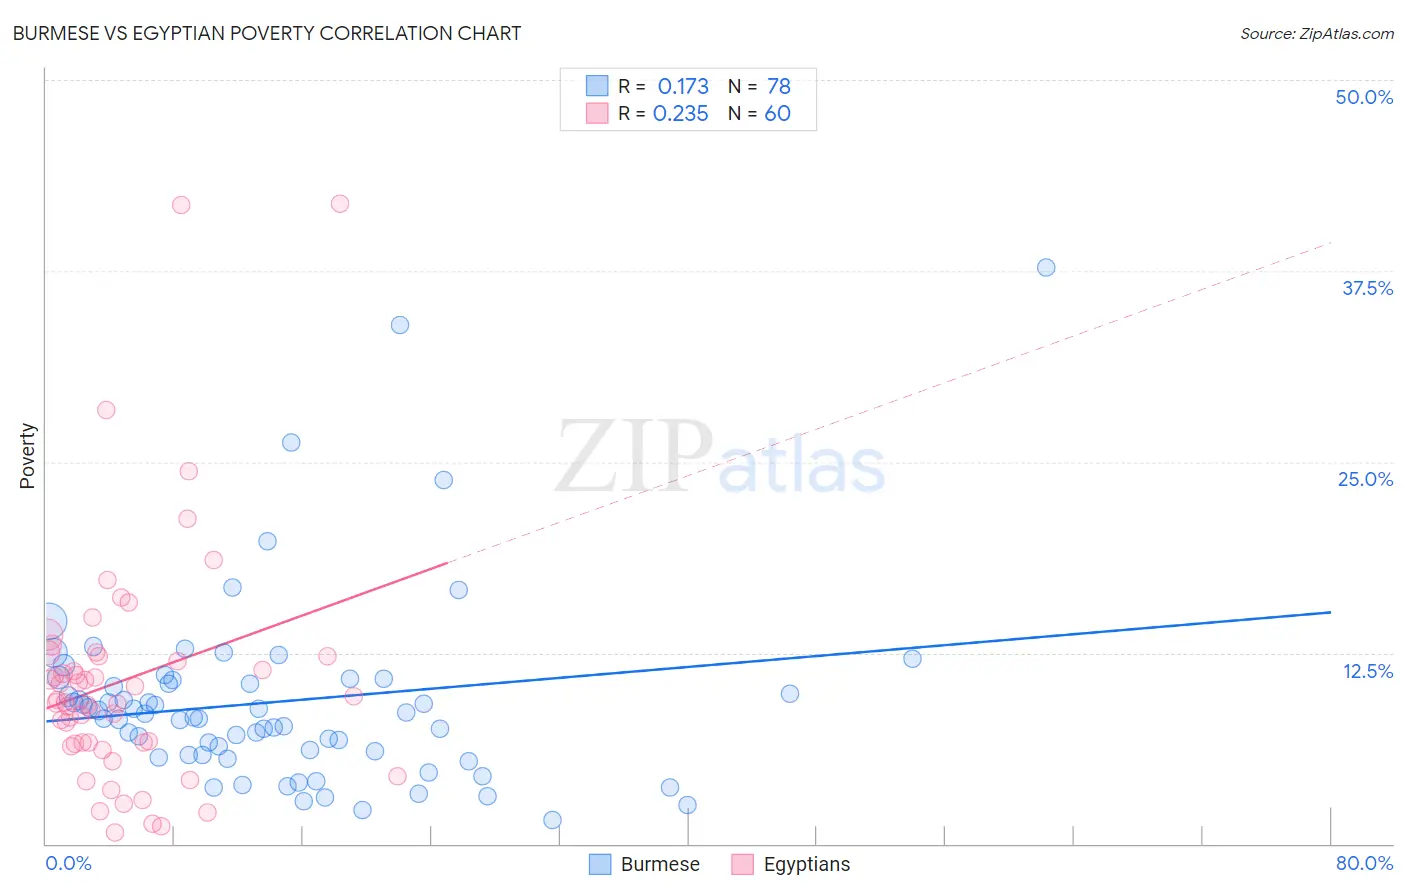
Burmese vs Egyptian Poverty Correlation Chart
The statistical analysis conducted on geographies consisting of 464,896,901 people shows a poor positive correlation between the proportion of Burmese and poverty level in the United States with a correlation coefficient (R) of 0.173 and weighted average of 10.7%. Similarly, the statistical analysis conducted on geographies consisting of 276,768,779 people shows a weak positive correlation between the proportion of Egyptians and poverty level in the United States with a correlation coefficient (R) of 0.235 and weighted average of 11.3%, a difference of 6.2%.
Poverty Correlation Summary
| Measurement | Burmese | Egyptian |
| Minimum | 1.6% | 0.75% |
| Maximum | 37.7% | 41.9% |
| Range | 36.2% | 41.2% |
| Mean | 9.3% | 10.7% |
| Median | 8.4% | 9.3% |
| Interquartile 25% (IQ1) | 5.8% | 6.6% |
| Interquartile 75% (IQ3) | 10.8% | 12.3% |
| Interquartile Range (IQR) | 4.9% | 5.7% |
| Standard Deviation (Sample) | 6.2% | 7.9% |
| Standard Deviation (Population) | 6.1% | 7.8% |
Similar Demographics by Poverty
Demographics Similar to Burmese by Poverty
In terms of poverty, the demographic groups most similar to Burmese are Croatian (10.6%, a difference of 0.31%), Immigrants from Northern Europe (10.7%, a difference of 0.36%), Immigrants from Korea (10.7%, a difference of 0.42%), Italian (10.6%, a difference of 0.50%), and Greek (10.7%, a difference of 0.52%).
| Demographics | Rating | Rank | Poverty |
| Immigrants | Scotland | 99.7 /100 | #19 | Exceptional 10.6% |
| Immigrants | North Macedonia | 99.7 /100 | #20 | Exceptional 10.6% |
| Luxembourgers | 99.7 /100 | #21 | Exceptional 10.6% |
| Eastern Europeans | 99.7 /100 | #22 | Exceptional 10.6% |
| Swedes | 99.7 /100 | #23 | Exceptional 10.6% |
| Italians | 99.7 /100 | #24 | Exceptional 10.6% |
| Croatians | 99.6 /100 | #25 | Exceptional 10.6% |
| Burmese | 99.6 /100 | #26 | Exceptional 10.7% |
| Immigrants | Northern Europe | 99.6 /100 | #27 | Exceptional 10.7% |
| Immigrants | Korea | 99.5 /100 | #28 | Exceptional 10.7% |
| Greeks | 99.5 /100 | #29 | Exceptional 10.7% |
| Danes | 99.5 /100 | #30 | Exceptional 10.7% |
| Poles | 99.5 /100 | #31 | Exceptional 10.7% |
| Iranians | 99.5 /100 | #32 | Exceptional 10.7% |
| Macedonians | 99.4 /100 | #33 | Exceptional 10.8% |
Demographics Similar to Egyptians by Poverty
In terms of poverty, the demographic groups most similar to Egyptians are Irish (11.3%, a difference of 0.090%), Indian (Asian) (11.3%, a difference of 0.10%), Cambodian (11.3%, a difference of 0.12%), Dutch (11.3%, a difference of 0.16%), and Immigrants from Eastern Asia (11.3%, a difference of 0.18%).
| Demographics | Rating | Rank | Poverty |
| Immigrants | Eastern Europe | 97.0 /100 | #75 | Exceptional 11.3% |
| Immigrants | North America | 96.8 /100 | #76 | Exceptional 11.3% |
| Immigrants | Eastern Asia | 96.7 /100 | #77 | Exceptional 11.3% |
| Dutch | 96.7 /100 | #78 | Exceptional 11.3% |
| Cambodians | 96.7 /100 | #79 | Exceptional 11.3% |
| Indians (Asian) | 96.6 /100 | #80 | Exceptional 11.3% |
| Irish | 96.6 /100 | #81 | Exceptional 11.3% |
| Egyptians | 96.5 /100 | #82 | Exceptional 11.3% |
| Immigrants | Sweden | 96.3 /100 | #83 | Exceptional 11.3% |
| English | 96.3 /100 | #84 | Exceptional 11.3% |
| Immigrants | England | 96.2 /100 | #85 | Exceptional 11.4% |
| Jordanians | 96.0 /100 | #86 | Exceptional 11.4% |
| Northern Europeans | 96.0 /100 | #87 | Exceptional 11.4% |
| Belgians | 95.8 /100 | #88 | Exceptional 11.4% |
| Czechoslovakians | 95.7 /100 | #89 | Exceptional 11.4% |