Cajun vs Australian Single Male Poverty
COMPARE
Cajun
Australian
Single Male Poverty
Single Male Poverty Comparison
Cajuns
Australians
19.1%
SINGLE MALE POVERTY
0.0/ 100
METRIC RATING
330th/ 347
METRIC RANK
12.6%
SINGLE MALE POVERTY
71.4/ 100
METRIC RATING
152nd/ 347
METRIC RANK
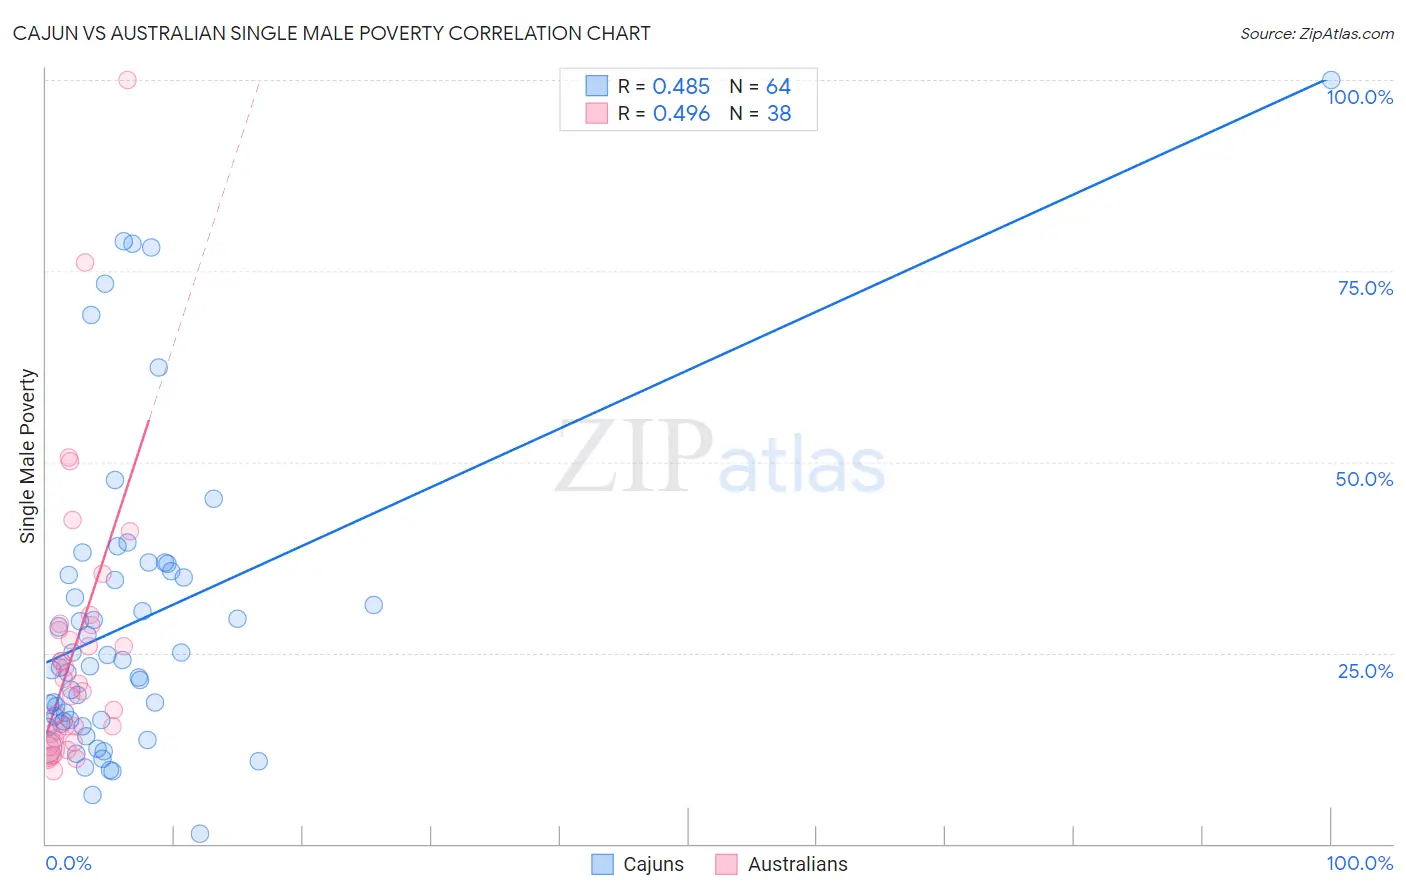
Cajun vs Australian Single Male Poverty Correlation Chart
The statistical analysis conducted on geographies consisting of 139,673,015 people shows a moderate positive correlation between the proportion of Cajuns and poverty level among single males in the United States with a correlation coefficient (R) of 0.485 and weighted average of 19.1%. Similarly, the statistical analysis conducted on geographies consisting of 203,982,275 people shows a moderate positive correlation between the proportion of Australians and poverty level among single males in the United States with a correlation coefficient (R) of 0.496 and weighted average of 12.6%, a difference of 50.8%.
Single Male Poverty Correlation Summary
| Measurement | Cajun | Australian |
| Minimum | 1.3% | 9.6% |
| Maximum | 100.0% | 100.0% |
| Range | 98.7% | 90.4% |
| Mean | 28.9% | 25.6% |
| Median | 23.1% | 20.5% |
| Interquartile 25% (IQ1) | 15.9% | 13.8% |
| Interquartile 75% (IQ3) | 35.5% | 28.6% |
| Interquartile Range (IQR) | 19.6% | 14.7% |
| Standard Deviation (Sample) | 20.0% | 18.5% |
| Standard Deviation (Population) | 19.9% | 18.3% |
Similar Demographics by Single Male Poverty
Demographics Similar to Cajuns by Single Male Poverty
In terms of single male poverty, the demographic groups most similar to Cajuns are Paiute (19.3%, a difference of 1.1%), Native/Alaskan (19.6%, a difference of 2.8%), Colville (18.4%, a difference of 3.5%), Kiowa (18.3%, a difference of 4.2%), and Inupiat (20.0%, a difference of 4.8%).
| Demographics | Rating | Rank | Single Male Poverty |
| Creek | 0.0 /100 | #323 | Tragic 16.8% |
| Immigrants | Yemen | 0.0 /100 | #324 | Tragic 16.9% |
| Choctaw | 0.0 /100 | #325 | Tragic 17.0% |
| Central American Indians | 0.0 /100 | #326 | Tragic 17.2% |
| Menominee | 0.0 /100 | #327 | Tragic 17.7% |
| Kiowa | 0.0 /100 | #328 | Tragic 18.3% |
| Colville | 0.0 /100 | #329 | Tragic 18.4% |
| Cajuns | 0.0 /100 | #330 | Tragic 19.1% |
| Paiute | 0.0 /100 | #331 | Tragic 19.3% |
| Natives/Alaskans | 0.0 /100 | #332 | Tragic 19.6% |
| Inupiat | 0.0 /100 | #333 | Tragic 20.0% |
| Pima | 0.0 /100 | #334 | Tragic 20.2% |
| Yuman | 0.0 /100 | #335 | Tragic 21.3% |
| Tohono O'odham | 0.0 /100 | #336 | Tragic 21.6% |
| Apache | 0.0 /100 | #337 | Tragic 21.6% |
Demographics Similar to Australians by Single Male Poverty
In terms of single male poverty, the demographic groups most similar to Australians are Immigrants from Hungary (12.6%, a difference of 0.030%), Immigrants from Panama (12.6%, a difference of 0.050%), Immigrants (12.7%, a difference of 0.080%), Sierra Leonean (12.6%, a difference of 0.11%), and Immigrants from Scotland (12.7%, a difference of 0.16%).
| Demographics | Rating | Rank | Single Male Poverty |
| Immigrants | Lebanon | 75.0 /100 | #145 | Good 12.6% |
| Native Hawaiians | 75.0 /100 | #146 | Good 12.6% |
| Malaysians | 74.8 /100 | #147 | Good 12.6% |
| Yugoslavians | 73.9 /100 | #148 | Good 12.6% |
| Sierra Leoneans | 73.0 /100 | #149 | Good 12.6% |
| Immigrants | Panama | 72.1 /100 | #150 | Good 12.6% |
| Immigrants | Hungary | 71.9 /100 | #151 | Good 12.6% |
| Australians | 71.4 /100 | #152 | Good 12.6% |
| Immigrants | Immigrants | 70.1 /100 | #153 | Good 12.7% |
| Immigrants | Scotland | 68.9 /100 | #154 | Good 12.7% |
| Immigrants | Spain | 68.7 /100 | #155 | Good 12.7% |
| Vietnamese | 67.9 /100 | #156 | Good 12.7% |
| Latvians | 67.9 /100 | #157 | Good 12.7% |
| Immigrants | Middle Africa | 64.9 /100 | #158 | Good 12.7% |
| Immigrants | Liberia | 64.2 /100 | #159 | Good 12.7% |