Cherokee vs Immigrants from St. Vincent and the Grenadines Poverty
COMPARE
Cherokee
Immigrants from St. Vincent and the Grenadines
Poverty
Poverty Comparison
Cherokee
Immigrants from St. Vincent and the Grenadines
14.4%
POVERTY
0.1/ 100
METRIC RATING
261st/ 347
METRIC RANK
14.9%
POVERTY
0.0/ 100
METRIC RATING
279th/ 347
METRIC RANK
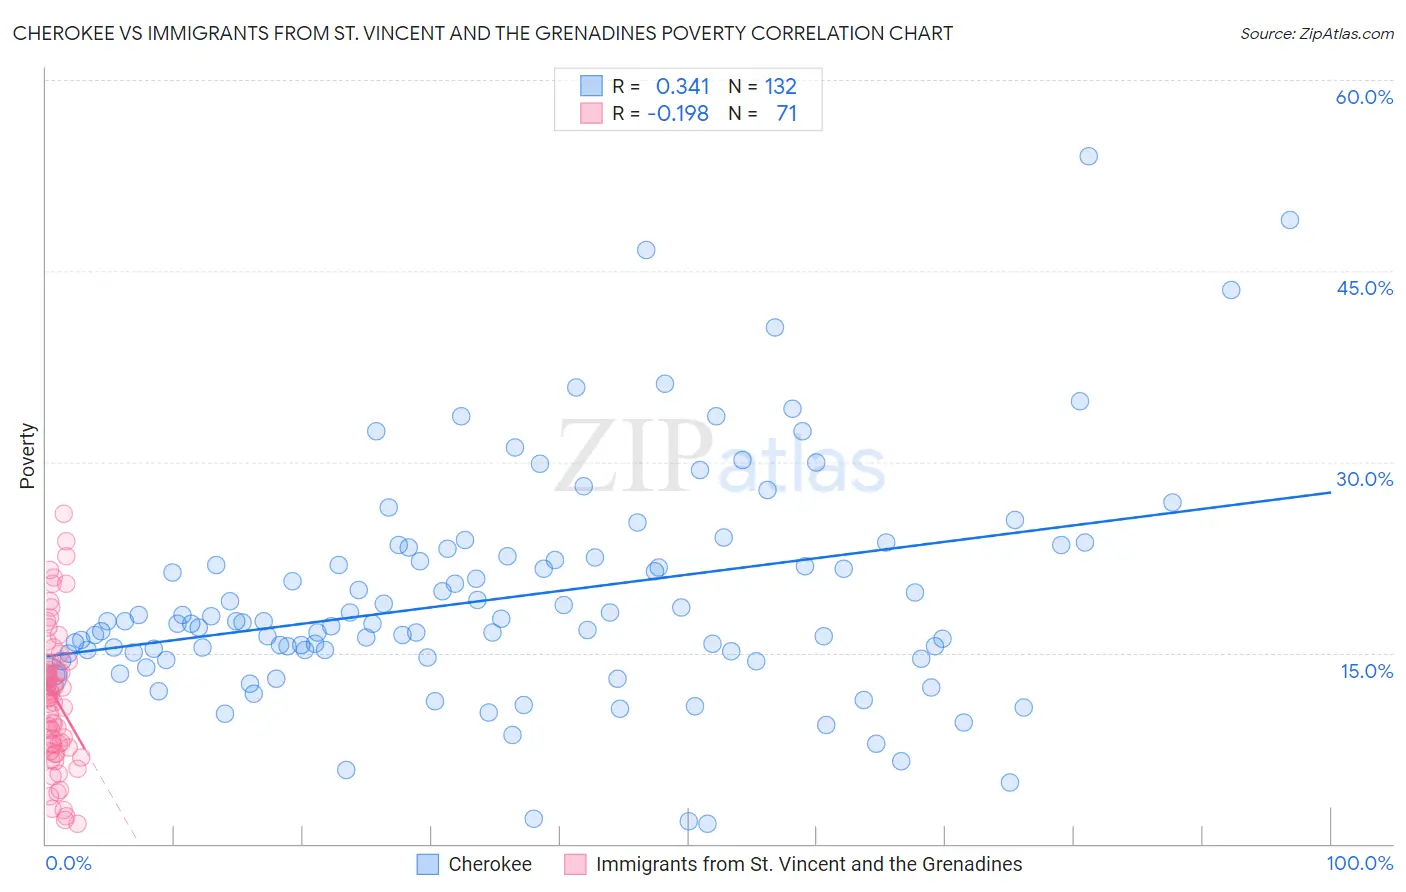
Cherokee vs Immigrants from St. Vincent and the Grenadines Poverty Correlation Chart
The statistical analysis conducted on geographies consisting of 493,337,715 people shows a mild positive correlation between the proportion of Cherokee and poverty level in the United States with a correlation coefficient (R) of 0.341 and weighted average of 14.4%. Similarly, the statistical analysis conducted on geographies consisting of 56,091,353 people shows a poor negative correlation between the proportion of Immigrants from St. Vincent and the Grenadines and poverty level in the United States with a correlation coefficient (R) of -0.198 and weighted average of 14.9%, a difference of 3.5%.
Poverty Correlation Summary
| Measurement | Cherokee | Immigrants from St. Vincent and the Grenadines |
| Minimum | 1.6% | 1.6% |
| Maximum | 54.1% | 25.9% |
| Range | 52.4% | 24.3% |
| Mean | 19.3% | 11.5% |
| Median | 17.3% | 11.5% |
| Interquartile 25% (IQ1) | 14.8% | 7.5% |
| Interquartile 75% (IQ3) | 22.5% | 14.2% |
| Interquartile Range (IQR) | 7.7% | 6.7% |
| Standard Deviation (Sample) | 8.8% | 5.5% |
| Standard Deviation (Population) | 8.8% | 5.5% |
Demographics Similar to Cherokee and Immigrants from St. Vincent and the Grenadines by Poverty
In terms of poverty, the demographic groups most similar to Cherokee are Cape Verdean (14.4%, a difference of 0.020%), Immigrants from Liberia (14.4%, a difference of 0.16%), Jamaican (14.4%, a difference of 0.51%), Immigrants from Jamaica (14.4%, a difference of 0.60%), and Immigrants from Guyana (14.5%, a difference of 0.72%). Similarly, the demographic groups most similar to Immigrants from St. Vincent and the Grenadines are Haitian (14.9%, a difference of 0.20%), Belizean (14.8%, a difference of 0.29%), Bangladeshi (14.8%, a difference of 0.31%), Immigrants from West Indies (14.8%, a difference of 0.37%), and Immigrants from Bahamas (14.8%, a difference of 0.37%).
| Demographics | Rating | Rank | Poverty |
| Cape Verdeans | 0.1 /100 | #260 | Tragic 14.4% |
| Cherokee | 0.1 /100 | #261 | Tragic 14.4% |
| Immigrants | Liberia | 0.1 /100 | #262 | Tragic 14.4% |
| Jamaicans | 0.1 /100 | #263 | Tragic 14.4% |
| Immigrants | Jamaica | 0.1 /100 | #264 | Tragic 14.4% |
| Immigrants | Guyana | 0.1 /100 | #265 | Tragic 14.5% |
| Guyanese | 0.1 /100 | #266 | Tragic 14.5% |
| Iroquois | 0.1 /100 | #267 | Tragic 14.5% |
| Sub-Saharan Africans | 0.1 /100 | #268 | Tragic 14.5% |
| Immigrants | Cuba | 0.1 /100 | #269 | Tragic 14.6% |
| Central Americans | 0.1 /100 | #270 | Tragic 14.6% |
| Shoshone | 0.0 /100 | #271 | Tragic 14.7% |
| Chickasaw | 0.0 /100 | #272 | Tragic 14.7% |
| Spanish Americans | 0.0 /100 | #273 | Tragic 14.7% |
| Barbadians | 0.0 /100 | #274 | Tragic 14.8% |
| Immigrants | West Indies | 0.0 /100 | #275 | Tragic 14.8% |
| Immigrants | Bahamas | 0.0 /100 | #276 | Tragic 14.8% |
| Bangladeshis | 0.0 /100 | #277 | Tragic 14.8% |
| Belizeans | 0.0 /100 | #278 | Tragic 14.8% |
| Immigrants | St. Vincent and the Grenadines | 0.0 /100 | #279 | Tragic 14.9% |
| Haitians | 0.0 /100 | #280 | Tragic 14.9% |