Chilean vs Immigrants from Philippines Receiving Food Stamps
COMPARE
Chilean
Immigrants from Philippines
Receiving Food Stamps
Receiving Food Stamps Comparison
Chileans
Immigrants from Philippines
11.0%
RECEIVING FOOD STAMPS
86.2/ 100
METRIC RATING
142nd/ 347
METRIC RANK
10.7%
RECEIVING FOOD STAMPS
93.3/ 100
METRIC RATING
123rd/ 347
METRIC RANK
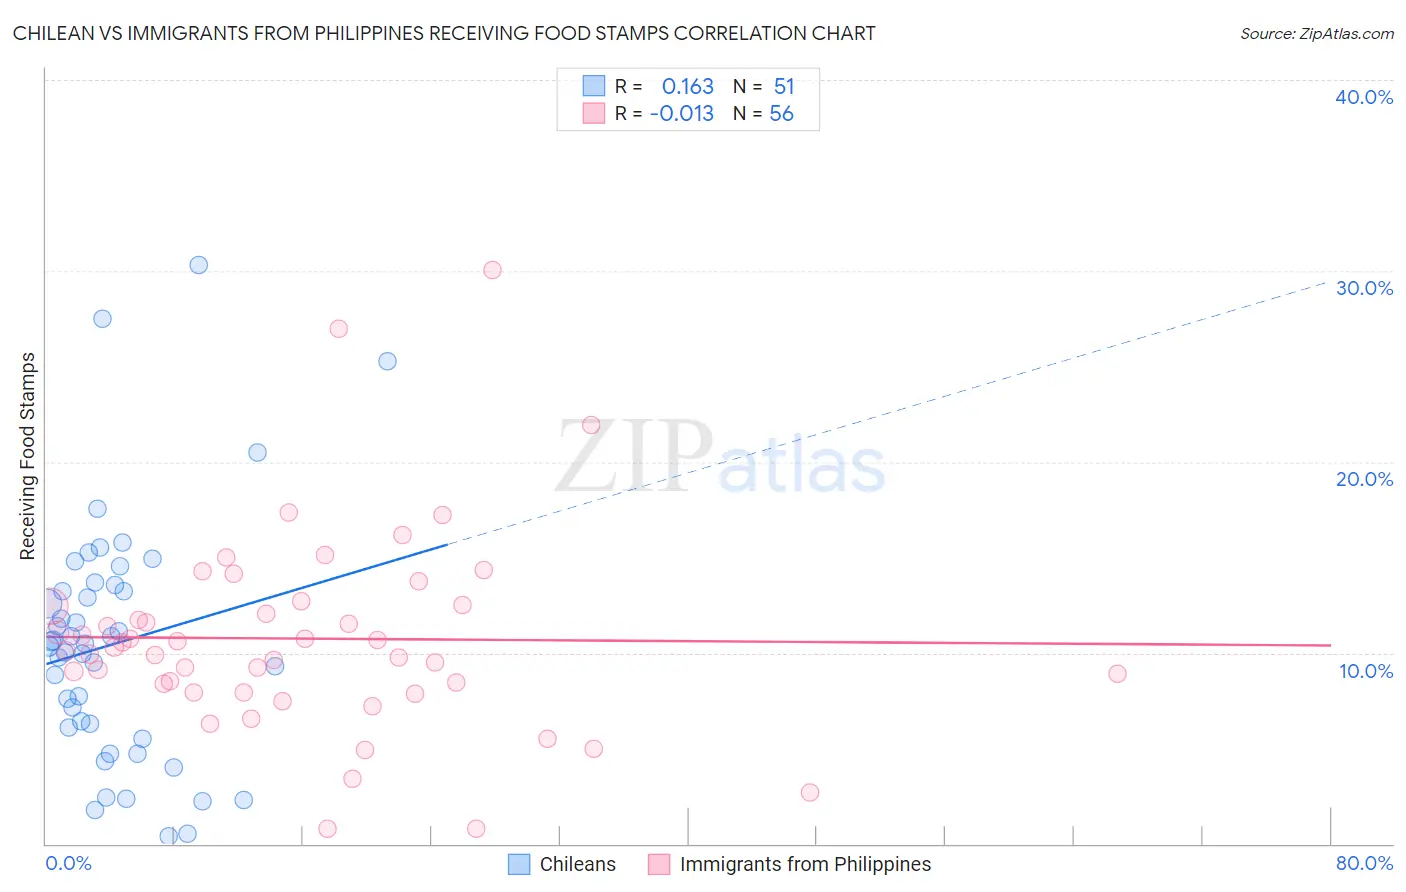
Chilean vs Immigrants from Philippines Receiving Food Stamps Correlation Chart
The statistical analysis conducted on geographies consisting of 256,152,699 people shows a poor positive correlation between the proportion of Chileans and percentage of population receiving government assistance and/or food stamps in the United States with a correlation coefficient (R) of 0.163 and weighted average of 11.0%. Similarly, the statistical analysis conducted on geographies consisting of 469,841,881 people shows no correlation between the proportion of Immigrants from Philippines and percentage of population receiving government assistance and/or food stamps in the United States with a correlation coefficient (R) of -0.013 and weighted average of 10.7%, a difference of 3.1%.
Receiving Food Stamps Correlation Summary
| Measurement | Chilean | Immigrants from Philippines |
| Minimum | 0.40% | 0.80% |
| Maximum | 30.3% | 30.1% |
| Range | 29.9% | 29.3% |
| Mean | 10.5% | 10.7% |
| Median | 10.5% | 10.2% |
| Interquartile 25% (IQ1) | 6.1% | 8.1% |
| Interquartile 75% (IQ3) | 13.5% | 12.5% |
| Interquartile Range (IQR) | 7.4% | 4.3% |
| Standard Deviation (Sample) | 6.4% | 5.2% |
| Standard Deviation (Population) | 6.3% | 5.2% |
Demographics Similar to Chileans and Immigrants from Philippines by Receiving Food Stamps
In terms of receiving food stamps, the demographic groups most similar to Chileans are Immigrants from Vietnam (11.0%, a difference of 0.17%), Celtic (10.9%, a difference of 0.53%), Hmong (10.9%, a difference of 0.73%), Immigrants from Moldova (10.9%, a difference of 0.77%), and Immigrants from Eastern Europe (10.8%, a difference of 1.3%). Similarly, the demographic groups most similar to Immigrants from Philippines are Paraguayan (10.7%, a difference of 0.21%), Sri Lankan (10.6%, a difference of 0.25%), Ukrainian (10.7%, a difference of 0.29%), Afghan (10.7%, a difference of 0.43%), and Immigrants from Ethiopia (10.7%, a difference of 0.46%).
| Demographics | Rating | Rank | Receiving Food Stamps |
| Sri Lankans | 93.7 /100 | #122 | Exceptional 10.6% |
| Immigrants | Philippines | 93.3 /100 | #123 | Exceptional 10.7% |
| Paraguayans | 93.0 /100 | #124 | Exceptional 10.7% |
| Ukrainians | 92.8 /100 | #125 | Exceptional 10.7% |
| Afghans | 92.6 /100 | #126 | Exceptional 10.7% |
| Immigrants | Ethiopia | 92.6 /100 | #127 | Exceptional 10.7% |
| Immigrants | Jordan | 92.5 /100 | #128 | Exceptional 10.7% |
| Yugoslavians | 92.5 /100 | #129 | Exceptional 10.7% |
| Israelis | 92.4 /100 | #130 | Exceptional 10.7% |
| French | 92.3 /100 | #131 | Exceptional 10.7% |
| Immigrants | Germany | 92.0 /100 | #132 | Exceptional 10.7% |
| Immigrants | Russia | 90.9 /100 | #133 | Exceptional 10.8% |
| Immigrants | Brazil | 90.3 /100 | #134 | Exceptional 10.8% |
| Argentineans | 90.2 /100 | #135 | Exceptional 10.8% |
| Slovaks | 89.8 /100 | #136 | Excellent 10.8% |
| Immigrants | Eastern Europe | 89.8 /100 | #137 | Excellent 10.8% |
| Immigrants | Moldova | 88.5 /100 | #138 | Excellent 10.9% |
| Hmong | 88.4 /100 | #139 | Excellent 10.9% |
| Celtics | 87.8 /100 | #140 | Excellent 10.9% |
| Immigrants | Vietnam | 86.7 /100 | #141 | Excellent 11.0% |
| Chileans | 86.2 /100 | #142 | Excellent 11.0% |