Crow vs Immigrants from Brazil Poverty
COMPARE
Crow
Immigrants from Brazil
Poverty
Poverty Comparison
Crow
Immigrants from Brazil
20.7%
POVERTY
0.0/ 100
METRIC RATING
339th/ 347
METRIC RANK
11.7%
POVERTY
88.2/ 100
METRIC RATING
125th/ 347
METRIC RANK
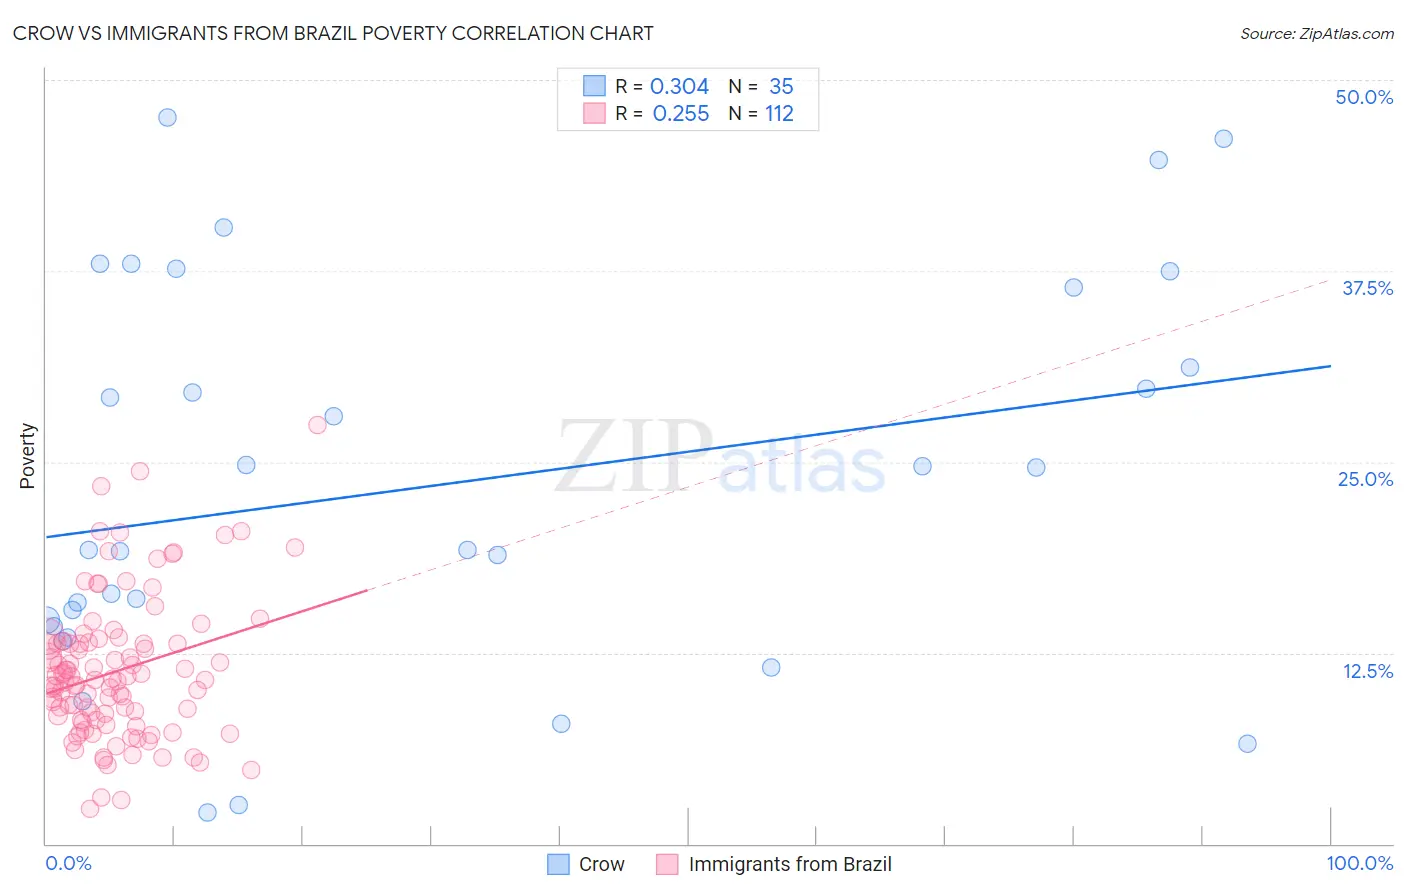
Crow vs Immigrants from Brazil Poverty Correlation Chart
The statistical analysis conducted on geographies consisting of 59,200,262 people shows a mild positive correlation between the proportion of Crow and poverty level in the United States with a correlation coefficient (R) of 0.304 and weighted average of 20.7%. Similarly, the statistical analysis conducted on geographies consisting of 342,843,961 people shows a weak positive correlation between the proportion of Immigrants from Brazil and poverty level in the United States with a correlation coefficient (R) of 0.255 and weighted average of 11.7%, a difference of 76.3%.
Poverty Correlation Summary
| Measurement | Crow | Immigrants from Brazil |
| Minimum | 2.1% | 2.3% |
| Maximum | 47.5% | 27.4% |
| Range | 45.4% | 25.1% |
| Mean | 23.5% | 11.3% |
| Median | 19.2% | 10.7% |
| Interquartile 25% (IQ1) | 14.3% | 8.1% |
| Interquartile 75% (IQ3) | 36.4% | 13.2% |
| Interquartile Range (IQR) | 22.1% | 5.1% |
| Standard Deviation (Sample) | 12.7% | 4.6% |
| Standard Deviation (Population) | 12.5% | 4.6% |
Similar Demographics by Poverty
Demographics Similar to Crow by Poverty
In terms of poverty, the demographic groups most similar to Crow are Yup'ik (20.8%, a difference of 0.75%), Hopi (20.8%, a difference of 0.93%), Yuman (20.2%, a difference of 2.2%), Immigrants from Yemen (21.5%, a difference of 4.1%), and Sioux (19.8%, a difference of 4.5%).
| Demographics | Rating | Rank | Poverty |
| Natives/Alaskans | 0.0 /100 | #332 | Tragic 18.1% |
| Houma | 0.0 /100 | #333 | Tragic 18.4% |
| Apache | 0.0 /100 | #334 | Tragic 18.4% |
| Cheyenne | 0.0 /100 | #335 | Tragic 18.9% |
| Pueblo | 0.0 /100 | #336 | Tragic 19.4% |
| Sioux | 0.0 /100 | #337 | Tragic 19.8% |
| Yuman | 0.0 /100 | #338 | Tragic 20.2% |
| Crow | 0.0 /100 | #339 | Tragic 20.7% |
| Yup'ik | 0.0 /100 | #340 | Tragic 20.8% |
| Hopi | 0.0 /100 | #341 | Tragic 20.8% |
| Immigrants | Yemen | 0.0 /100 | #342 | Tragic 21.5% |
| Pima | 0.0 /100 | #343 | Tragic 21.9% |
| Lumbee | 0.0 /100 | #344 | Tragic 21.9% |
| Navajo | 0.0 /100 | #345 | Tragic 23.1% |
| Puerto Ricans | 0.0 /100 | #346 | Tragic 23.7% |
Demographics Similar to Immigrants from Brazil by Poverty
In terms of poverty, the demographic groups most similar to Immigrants from Brazil are Soviet Union (11.7%, a difference of 0.040%), Immigrants from Norway (11.7%, a difference of 0.040%), Immigrants from Argentina (11.7%, a difference of 0.060%), Immigrants from Hungary (11.7%, a difference of 0.11%), and New Zealander (11.7%, a difference of 0.13%).
| Demographics | Rating | Rank | Poverty |
| Argentineans | 89.1 /100 | #118 | Excellent 11.7% |
| Tlingit-Haida | 89.0 /100 | #119 | Excellent 11.7% |
| Immigrants | South Eastern Asia | 88.9 /100 | #120 | Excellent 11.7% |
| New Zealanders | 88.7 /100 | #121 | Excellent 11.7% |
| Puget Sound Salish | 88.7 /100 | #122 | Excellent 11.7% |
| Immigrants | Hungary | 88.6 /100 | #123 | Excellent 11.7% |
| Soviet Union | 88.4 /100 | #124 | Excellent 11.7% |
| Immigrants | Brazil | 88.2 /100 | #125 | Excellent 11.7% |
| Immigrants | Norway | 88.0 /100 | #126 | Excellent 11.7% |
| Immigrants | Argentina | 88.0 /100 | #127 | Excellent 11.7% |
| Immigrants | Israel | 87.4 /100 | #128 | Excellent 11.7% |
| South Africans | 87.0 /100 | #129 | Excellent 11.7% |
| Immigrants | Ukraine | 86.6 /100 | #130 | Excellent 11.8% |
| French | 86.1 /100 | #131 | Excellent 11.8% |
| Peruvians | 85.6 /100 | #132 | Excellent 11.8% |