Fijian vs Paraguayan Child Poverty Under the Age of 16
COMPARE
Fijian
Paraguayan
Child Poverty Under the Age of 16
Child Poverty Under the Age of 16 Comparison
Fijians
Paraguayans
18.4%
CHILD POVERTY UNDER THE AGE OF 16
1.1/ 100
METRIC RATING
233rd/ 347
METRIC RANK
14.7%
CHILD POVERTY UNDER THE AGE OF 16
95.7/ 100
METRIC RATING
97th/ 347
METRIC RANK
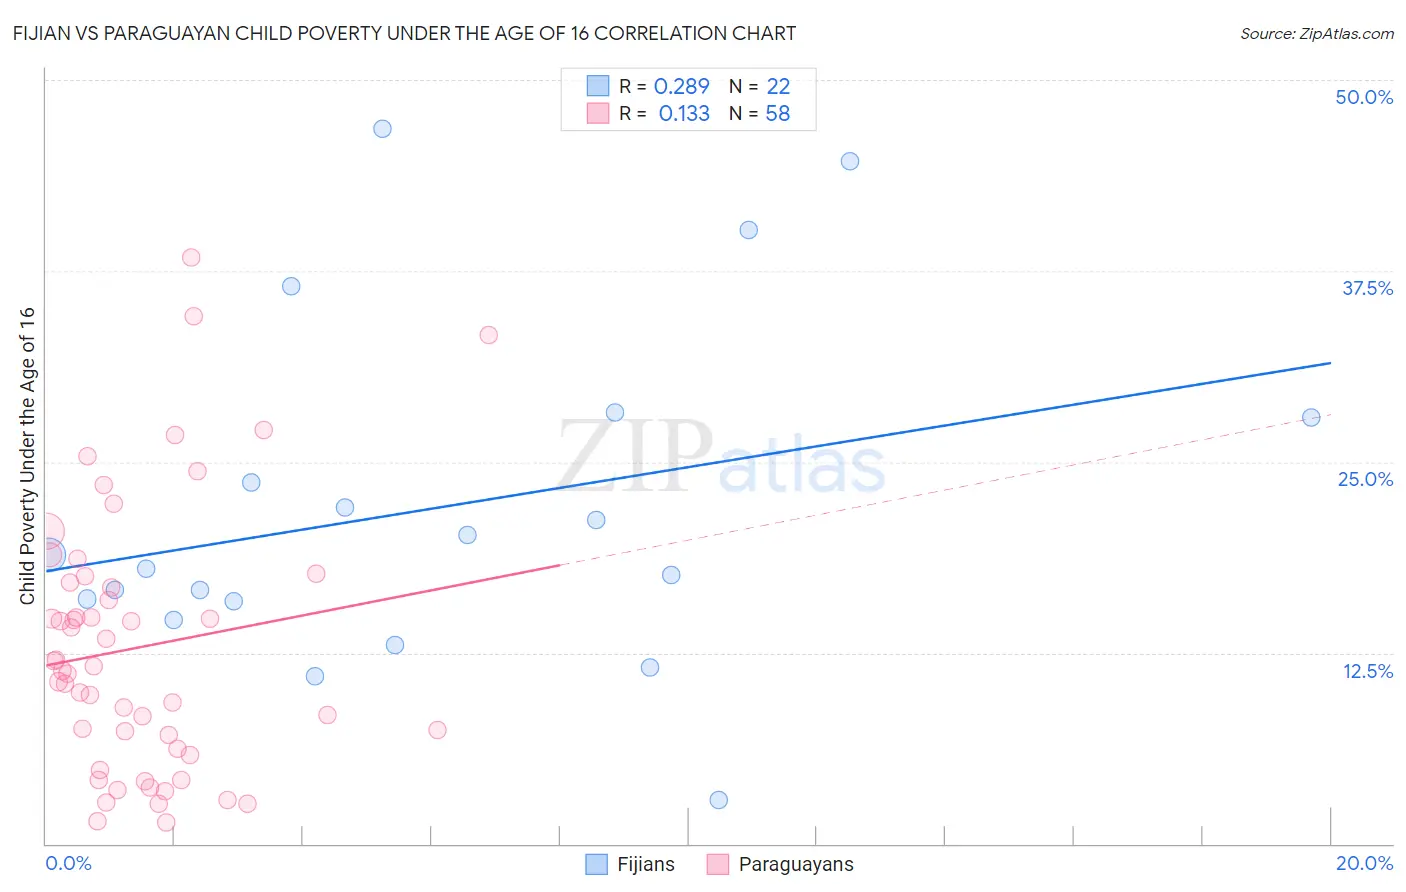
Fijian vs Paraguayan Child Poverty Under the Age of 16 Correlation Chart
The statistical analysis conducted on geographies consisting of 55,914,100 people shows a weak positive correlation between the proportion of Fijians and poverty level among children under the age of 16 in the United States with a correlation coefficient (R) of 0.289 and weighted average of 18.4%. Similarly, the statistical analysis conducted on geographies consisting of 94,860,447 people shows a poor positive correlation between the proportion of Paraguayans and poverty level among children under the age of 16 in the United States with a correlation coefficient (R) of 0.133 and weighted average of 14.7%, a difference of 25.1%.
Child Poverty Under the Age of 16 Correlation Summary
| Measurement | Fijian | Paraguayan |
| Minimum | 2.8% | 1.4% |
| Maximum | 46.8% | 38.4% |
| Range | 43.9% | 37.0% |
| Mean | 22.0% | 12.9% |
| Median | 18.5% | 11.5% |
| Interquartile 25% (IQ1) | 15.9% | 6.2% |
| Interquartile 75% (IQ3) | 27.9% | 17.1% |
| Interquartile Range (IQR) | 12.0% | 10.9% |
| Standard Deviation (Sample) | 11.3% | 8.6% |
| Standard Deviation (Population) | 11.0% | 8.5% |
Similar Demographics by Child Poverty Under the Age of 16
Demographics Similar to Fijians by Child Poverty Under the Age of 16
In terms of child poverty under the age of 16, the demographic groups most similar to Fijians are American (18.3%, a difference of 0.22%), Immigrants from Nigeria (18.4%, a difference of 0.25%), Nigerian (18.4%, a difference of 0.31%), Cree (18.5%, a difference of 0.60%), and Sudanese (18.5%, a difference of 0.63%).
| Demographics | Rating | Rank | Child Poverty Under the Age of 16 |
| Bermudans | 2.6 /100 | #226 | Tragic 18.0% |
| Immigrants | Africa | 2.5 /100 | #227 | Tragic 18.0% |
| Immigrants | Micronesia | 2.3 /100 | #228 | Tragic 18.0% |
| Marshallese | 1.8 /100 | #229 | Tragic 18.1% |
| Nepalese | 1.7 /100 | #230 | Tragic 18.2% |
| Nicaraguans | 1.7 /100 | #231 | Tragic 18.2% |
| Americans | 1.2 /100 | #232 | Tragic 18.3% |
| Fijians | 1.1 /100 | #233 | Tragic 18.4% |
| Immigrants | Nigeria | 1.0 /100 | #234 | Tragic 18.4% |
| Nigerians | 1.0 /100 | #235 | Tragic 18.4% |
| Cree | 0.9 /100 | #236 | Tragic 18.5% |
| Sudanese | 0.9 /100 | #237 | Tragic 18.5% |
| Immigrants | Eritrea | 0.8 /100 | #238 | Tragic 18.5% |
| Immigrants | Sudan | 0.8 /100 | #239 | Tragic 18.5% |
| Ghanaians | 0.8 /100 | #240 | Tragic 18.6% |
Demographics Similar to Paraguayans by Child Poverty Under the Age of 16
In terms of child poverty under the age of 16, the demographic groups most similar to Paraguayans are Immigrants from Belarus (14.7%, a difference of 0.010%), Immigrants from France (14.7%, a difference of 0.12%), British (14.7%, a difference of 0.13%), Immigrants from Croatia (14.6%, a difference of 0.36%), and Dutch (14.8%, a difference of 0.45%).
| Demographics | Rating | Rank | Child Poverty Under the Age of 16 |
| Austrians | 96.9 /100 | #90 | Exceptional 14.5% |
| Immigrants | North America | 96.7 /100 | #91 | Exceptional 14.6% |
| Immigrants | Italy | 96.7 /100 | #92 | Exceptional 14.6% |
| Argentineans | 96.6 /100 | #93 | Exceptional 14.6% |
| Immigrants | South Africa | 96.3 /100 | #94 | Exceptional 14.6% |
| Immigrants | Croatia | 96.1 /100 | #95 | Exceptional 14.6% |
| Immigrants | France | 95.8 /100 | #96 | Exceptional 14.7% |
| Paraguayans | 95.7 /100 | #97 | Exceptional 14.7% |
| Immigrants | Belarus | 95.7 /100 | #98 | Exceptional 14.7% |
| British | 95.5 /100 | #99 | Exceptional 14.7% |
| Dutch | 95.1 /100 | #100 | Exceptional 14.8% |
| Immigrants | Switzerland | 95.1 /100 | #101 | Exceptional 14.8% |
| Romanians | 95.0 /100 | #102 | Exceptional 14.8% |
| Immigrants | Egypt | 94.9 /100 | #103 | Exceptional 14.8% |
| Immigrants | England | 94.8 /100 | #104 | Exceptional 14.8% |