French vs Immigrants from Sri Lanka Family Poverty
COMPARE
French
Immigrants from Sri Lanka
Family Poverty
Family Poverty Comparison
French
Immigrants from Sri Lanka
8.3%
FAMILY POVERTY
92.8/ 100
METRIC RATING
119th/ 347
METRIC RANK
7.7%
FAMILY POVERTY
98.9/ 100
METRIC RATING
48th/ 347
METRIC RANK
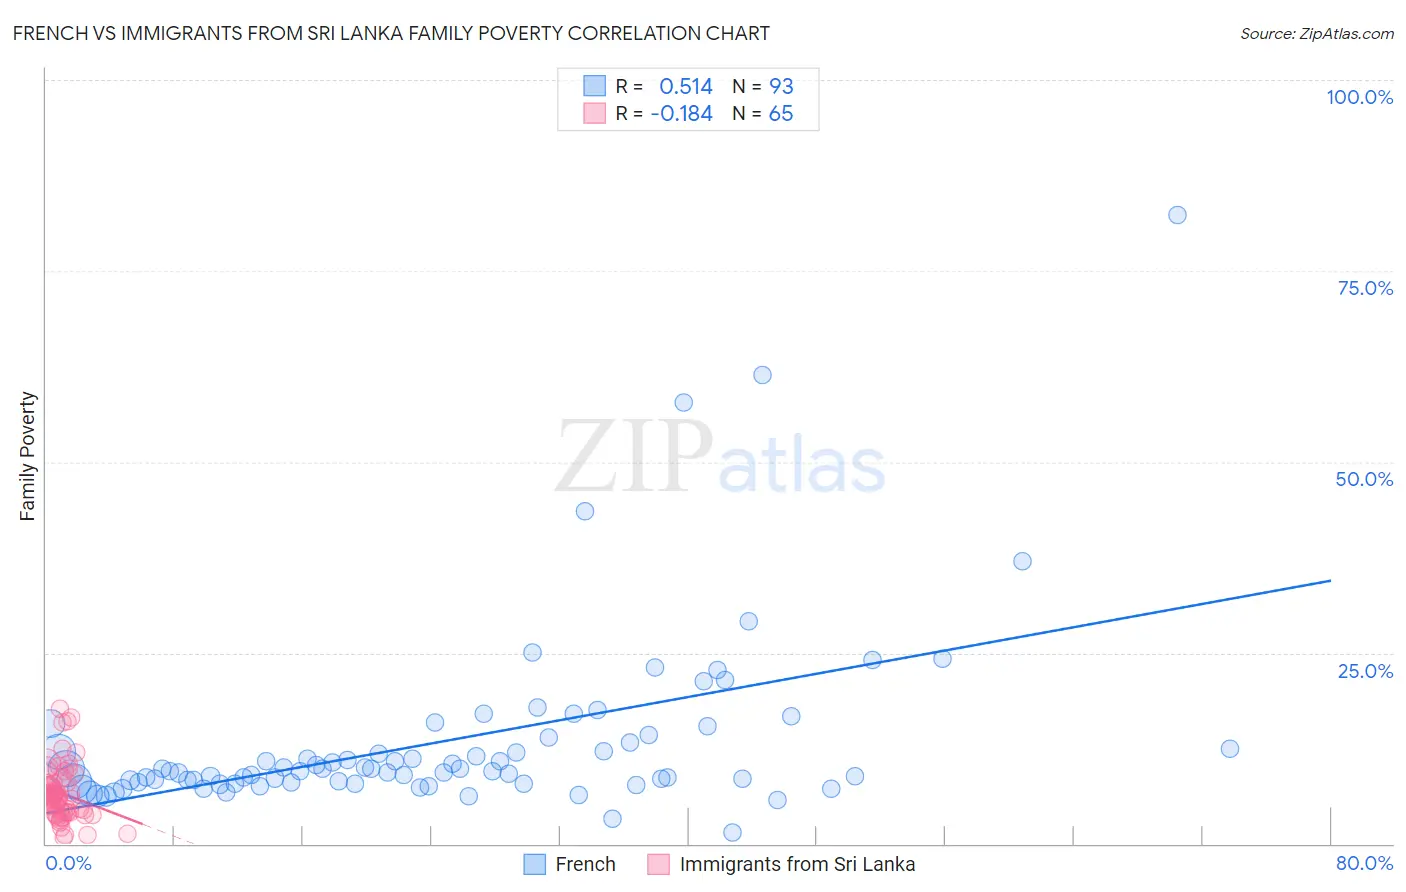
French vs Immigrants from Sri Lanka Family Poverty Correlation Chart
The statistical analysis conducted on geographies consisting of 567,554,801 people shows a substantial positive correlation between the proportion of French and poverty level among families in the United States with a correlation coefficient (R) of 0.514 and weighted average of 8.3%. Similarly, the statistical analysis conducted on geographies consisting of 149,580,330 people shows a poor negative correlation between the proportion of Immigrants from Sri Lanka and poverty level among families in the United States with a correlation coefficient (R) of -0.184 and weighted average of 7.7%, a difference of 7.6%.
Family Poverty Correlation Summary
| Measurement | French | Immigrants from Sri Lanka |
| Minimum | 1.5% | 0.89% |
| Maximum | 82.4% | 17.7% |
| Range | 80.9% | 16.8% |
| Mean | 13.4% | 6.6% |
| Median | 9.6% | 6.1% |
| Interquartile 25% (IQ1) | 8.0% | 4.1% |
| Interquartile 75% (IQ3) | 13.6% | 8.0% |
| Interquartile Range (IQR) | 5.6% | 3.9% |
| Standard Deviation (Sample) | 12.0% | 3.6% |
| Standard Deviation (Population) | 11.9% | 3.6% |
Similar Demographics by Family Poverty
Demographics Similar to French by Family Poverty
In terms of family poverty, the demographic groups most similar to French are Immigrants from Western Europe (8.2%, a difference of 0.070%), Immigrants from Russia (8.2%, a difference of 0.26%), South African (8.2%, a difference of 0.33%), Immigrants from Israel (8.2%, a difference of 0.39%), and Immigrants from Egypt (8.3%, a difference of 0.56%).
| Demographics | Rating | Rank | Family Poverty |
| Immigrants | France | 94.4 /100 | #112 | Exceptional 8.2% |
| Canadians | 94.2 /100 | #113 | Exceptional 8.2% |
| Immigrants | Zimbabwe | 94.0 /100 | #114 | Exceptional 8.2% |
| Immigrants | Israel | 93.5 /100 | #115 | Exceptional 8.2% |
| South Africans | 93.4 /100 | #116 | Exceptional 8.2% |
| Immigrants | Russia | 93.2 /100 | #117 | Exceptional 8.2% |
| Immigrants | Western Europe | 92.9 /100 | #118 | Exceptional 8.2% |
| French | 92.8 /100 | #119 | Exceptional 8.3% |
| Immigrants | Egypt | 91.6 /100 | #120 | Exceptional 8.3% |
| Native Hawaiians | 91.3 /100 | #121 | Exceptional 8.3% |
| Paraguayans | 91.2 /100 | #122 | Exceptional 8.3% |
| Palestinians | 91.1 /100 | #123 | Exceptional 8.3% |
| Soviet Union | 90.8 /100 | #124 | Exceptional 8.3% |
| Pakistanis | 90.8 /100 | #125 | Exceptional 8.3% |
| Icelanders | 90.3 /100 | #126 | Exceptional 8.3% |
Demographics Similar to Immigrants from Sri Lanka by Family Poverty
In terms of family poverty, the demographic groups most similar to Immigrants from Sri Lanka are Immigrants from Czechoslovakia (7.7%, a difference of 0.020%), Tongan (7.7%, a difference of 0.030%), Okinawan (7.7%, a difference of 0.040%), German (7.7%, a difference of 0.17%), and Immigrants from Bolivia (7.7%, a difference of 0.19%).
| Demographics | Rating | Rank | Family Poverty |
| Immigrants | Australia | 99.2 /100 | #41 | Exceptional 7.6% |
| Scandinavians | 99.1 /100 | #42 | Exceptional 7.6% |
| Immigrants | Austria | 99.1 /100 | #43 | Exceptional 7.6% |
| Germans | 99.0 /100 | #44 | Exceptional 7.7% |
| Okinawans | 98.9 /100 | #45 | Exceptional 7.7% |
| Tongans | 98.9 /100 | #46 | Exceptional 7.7% |
| Immigrants | Czechoslovakia | 98.9 /100 | #47 | Exceptional 7.7% |
| Immigrants | Sri Lanka | 98.9 /100 | #48 | Exceptional 7.7% |
| Immigrants | Bolivia | 98.9 /100 | #49 | Exceptional 7.7% |
| Immigrants | North Macedonia | 98.9 /100 | #50 | Exceptional 7.7% |
| Immigrants | Moldova | 98.8 /100 | #51 | Exceptional 7.7% |
| Indians (Asian) | 98.8 /100 | #52 | Exceptional 7.7% |
| Swiss | 98.8 /100 | #53 | Exceptional 7.7% |
| Immigrants | Sweden | 98.8 /100 | #54 | Exceptional 7.7% |
| Immigrants | Eastern Asia | 98.7 /100 | #55 | Exceptional 7.7% |