German Russian vs Immigrants from Cabo Verde Female Poverty Among 25-34 Year Olds
COMPARE
German Russian
Immigrants from Cabo Verde
Female Poverty Among 25-34 Year Olds
Female Poverty Among 25-34 Year Olds Comparison
German Russians
Immigrants from Cabo Verde
14.9%
FEMALE POVERTY AMONG 25-34 YEAR OLDS
0.8/ 100
METRIC RATING
247th/ 347
METRIC RANK
16.9%
FEMALE POVERTY AMONG 25-34 YEAR OLDS
0.0/ 100
METRIC RATING
305th/ 347
METRIC RANK
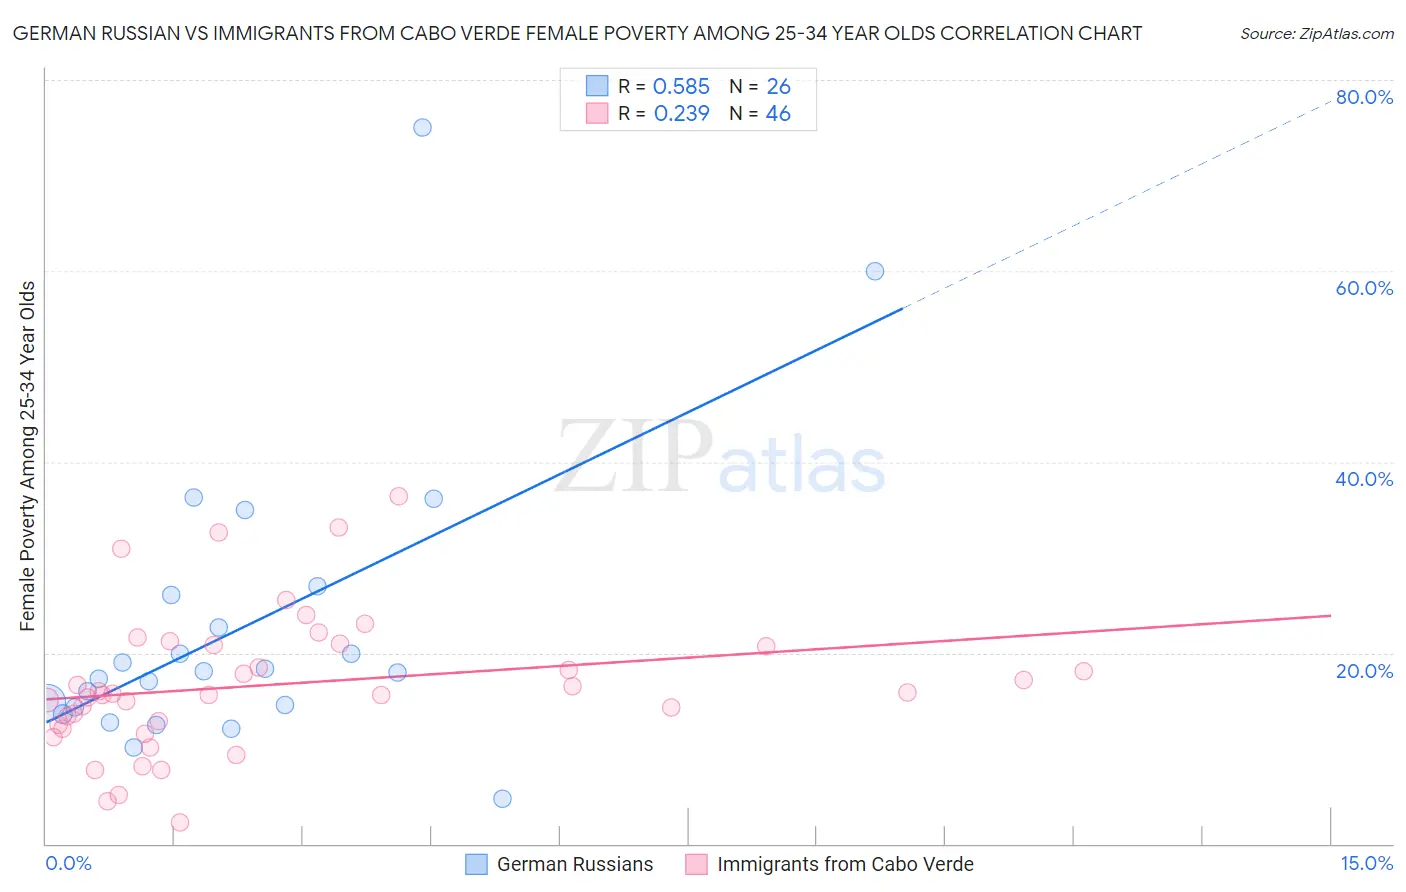
German Russian vs Immigrants from Cabo Verde Female Poverty Among 25-34 Year Olds Correlation Chart
The statistical analysis conducted on geographies consisting of 96,128,428 people shows a substantial positive correlation between the proportion of German Russians and poverty level among females between the ages 25 and 34 in the United States with a correlation coefficient (R) of 0.585 and weighted average of 14.9%. Similarly, the statistical analysis conducted on geographies consisting of 37,988,788 people shows a weak positive correlation between the proportion of Immigrants from Cabo Verde and poverty level among females between the ages 25 and 34 in the United States with a correlation coefficient (R) of 0.239 and weighted average of 16.9%, a difference of 13.7%.
Female Poverty Among 25-34 Year Olds Correlation Summary
| Measurement | German Russian | Immigrants from Cabo Verde |
| Minimum | 4.7% | 2.3% |
| Maximum | 75.0% | 36.4% |
| Range | 70.3% | 34.2% |
| Mean | 22.7% | 16.7% |
| Median | 18.0% | 15.6% |
| Interquartile 25% (IQ1) | 14.3% | 12.5% |
| Interquartile 75% (IQ3) | 26.1% | 20.8% |
| Interquartile Range (IQR) | 11.8% | 8.3% |
| Standard Deviation (Sample) | 15.4% | 7.3% |
| Standard Deviation (Population) | 15.1% | 7.2% |
Similar Demographics by Female Poverty Among 25-34 Year Olds
Demographics Similar to German Russians by Female Poverty Among 25-34 Year Olds
In terms of female poverty among 25-34 year olds, the demographic groups most similar to German Russians are Immigrants from Western Africa (14.9%, a difference of 0.040%), Jamaican (14.8%, a difference of 0.34%), Immigrants from Middle Africa (14.8%, a difference of 0.38%), Immigrants from Bangladesh (14.8%, a difference of 0.56%), and Immigrants from Nicaragua (14.8%, a difference of 0.57%).
| Demographics | Rating | Rank | Female Poverty Among 25-34 Year Olds |
| Immigrants | Grenada | 1.3 /100 | #240 | Tragic 14.7% |
| Scotch-Irish | 1.2 /100 | #241 | Tragic 14.8% |
| Barbadians | 1.2 /100 | #242 | Tragic 14.8% |
| Immigrants | Nicaragua | 1.1 /100 | #243 | Tragic 14.8% |
| Immigrants | Bangladesh | 1.1 /100 | #244 | Tragic 14.8% |
| Immigrants | Middle Africa | 1.0 /100 | #245 | Tragic 14.8% |
| Jamaicans | 1.0 /100 | #246 | Tragic 14.8% |
| German Russians | 0.8 /100 | #247 | Tragic 14.9% |
| Immigrants | Western Africa | 0.8 /100 | #248 | Tragic 14.9% |
| Immigrants | Haiti | 0.5 /100 | #249 | Tragic 15.0% |
| Immigrants | El Salvador | 0.5 /100 | #250 | Tragic 15.0% |
| Haitians | 0.5 /100 | #251 | Tragic 15.0% |
| Belizeans | 0.4 /100 | #252 | Tragic 15.1% |
| Immigrants | West Indies | 0.4 /100 | #253 | Tragic 15.1% |
| Somalis | 0.4 /100 | #254 | Tragic 15.1% |
Demographics Similar to Immigrants from Cabo Verde by Female Poverty Among 25-34 Year Olds
In terms of female poverty among 25-34 year olds, the demographic groups most similar to Immigrants from Cabo Verde are Honduran (16.9%, a difference of 0.17%), Immigrants from Mexico (16.8%, a difference of 0.58%), Chickasaw (17.0%, a difference of 0.58%), Yaqui (17.0%, a difference of 0.60%), and African (17.0%, a difference of 0.80%).
| Demographics | Rating | Rank | Female Poverty Among 25-34 Year Olds |
| Blackfeet | 0.0 /100 | #298 | Tragic 16.7% |
| Spanish Americans | 0.0 /100 | #299 | Tragic 16.7% |
| U.S. Virgin Islanders | 0.0 /100 | #300 | Tragic 16.7% |
| Immigrants | Congo | 0.0 /100 | #301 | Tragic 16.7% |
| Alaska Natives | 0.0 /100 | #302 | Tragic 16.8% |
| Immigrants | Mexico | 0.0 /100 | #303 | Tragic 16.8% |
| Hondurans | 0.0 /100 | #304 | Tragic 16.9% |
| Immigrants | Cabo Verde | 0.0 /100 | #305 | Tragic 16.9% |
| Chickasaw | 0.0 /100 | #306 | Tragic 17.0% |
| Yaqui | 0.0 /100 | #307 | Tragic 17.0% |
| Africans | 0.0 /100 | #308 | Tragic 17.0% |
| Ottawa | 0.0 /100 | #309 | Tragic 17.1% |
| Cherokee | 0.0 /100 | #310 | Tragic 17.2% |
| Immigrants | Honduras | 0.0 /100 | #311 | Tragic 17.3% |
| Iroquois | 0.0 /100 | #312 | Tragic 17.5% |