German Russian vs Nepalese Single Male Poverty
COMPARE
German Russian
Nepalese
Single Male Poverty
Single Male Poverty Comparison
German Russians
Nepalese
13.6%
SINGLE MALE POVERTY
0.8/ 100
METRIC RATING
253rd/ 347
METRIC RANK
11.6%
SINGLE MALE POVERTY
99.9/ 100
METRIC RATING
47th/ 347
METRIC RANK
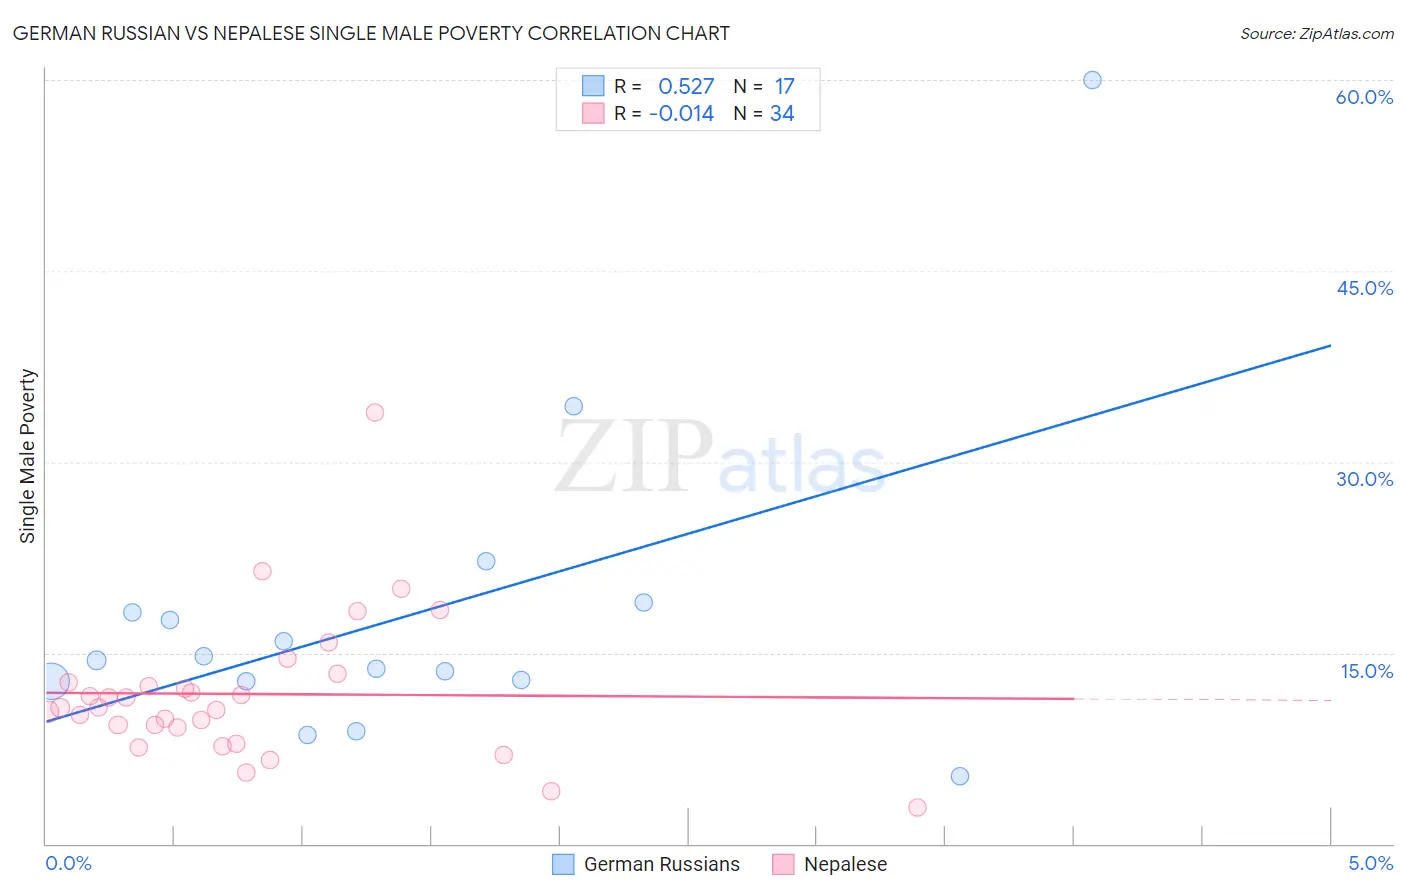
German Russian vs Nepalese Single Male Poverty Correlation Chart
The statistical analysis conducted on geographies consisting of 92,578,425 people shows a substantial positive correlation between the proportion of German Russians and poverty level among single males in the United States with a correlation coefficient (R) of 0.527 and weighted average of 13.6%. Similarly, the statistical analysis conducted on geographies consisting of 24,210,854 people shows no correlation between the proportion of Nepalese and poverty level among single males in the United States with a correlation coefficient (R) of -0.014 and weighted average of 11.6%, a difference of 17.5%.
Single Male Poverty Correlation Summary
| Measurement | German Russian | Nepalese |
| Minimum | 5.3% | 2.8% |
| Maximum | 60.0% | 33.9% |
| Range | 54.7% | 31.1% |
| Mean | 17.9% | 11.8% |
| Median | 14.4% | 10.7% |
| Interquartile 25% (IQ1) | 12.8% | 9.1% |
| Interquartile 75% (IQ3) | 18.6% | 12.7% |
| Interquartile Range (IQR) | 5.8% | 3.6% |
| Standard Deviation (Sample) | 12.6% | 5.7% |
| Standard Deviation (Population) | 12.2% | 5.6% |
Similar Demographics by Single Male Poverty
Demographics Similar to German Russians by Single Male Poverty
In terms of single male poverty, the demographic groups most similar to German Russians are Finnish (13.6%, a difference of 0.14%), Immigrants from Zaire (13.6%, a difference of 0.19%), Immigrants from Somalia (13.6%, a difference of 0.30%), Spanish (13.6%, a difference of 0.32%), and Czech (13.5%, a difference of 0.56%).
| Demographics | Rating | Rank | Single Male Poverty |
| Immigrants | Micronesia | 1.2 /100 | #246 | Tragic 13.5% |
| Belgians | 1.2 /100 | #247 | Tragic 13.5% |
| Czechs | 1.2 /100 | #248 | Tragic 13.5% |
| Spanish | 1.0 /100 | #249 | Tragic 13.6% |
| Immigrants | Somalia | 1.0 /100 | #250 | Tragic 13.6% |
| Immigrants | Zaire | 0.9 /100 | #251 | Tragic 13.6% |
| Finns | 0.9 /100 | #252 | Tragic 13.6% |
| German Russians | 0.8 /100 | #253 | Tragic 13.6% |
| Sub-Saharan Africans | 0.5 /100 | #254 | Tragic 13.7% |
| Spaniards | 0.4 /100 | #255 | Tragic 13.7% |
| Immigrants | Belize | 0.4 /100 | #256 | Tragic 13.7% |
| Immigrants | Central America | 0.3 /100 | #257 | Tragic 13.8% |
| Immigrants | Guatemala | 0.3 /100 | #258 | Tragic 13.8% |
| Guatemalans | 0.3 /100 | #259 | Tragic 13.8% |
| Swiss | 0.3 /100 | #260 | Tragic 13.8% |
Demographics Similar to Nepalese by Single Male Poverty
In terms of single male poverty, the demographic groups most similar to Nepalese are Immigrants from Indonesia (11.6%, a difference of 0.080%), Tlingit-Haida (11.6%, a difference of 0.10%), Immigrants from Lithuania (11.6%, a difference of 0.15%), Immigrants from Bulgaria (11.6%, a difference of 0.20%), and Paraguayan (11.6%, a difference of 0.26%).
| Demographics | Rating | Rank | Single Male Poverty |
| Immigrants | Korea | 100.0 /100 | #40 | Exceptional 11.5% |
| Immigrants | Iraq | 99.9 /100 | #41 | Exceptional 11.5% |
| Egyptians | 99.9 /100 | #42 | Exceptional 11.5% |
| Immigrants | Peru | 99.9 /100 | #43 | Exceptional 11.5% |
| Immigrants | Cameroon | 99.9 /100 | #44 | Exceptional 11.5% |
| Immigrants | Poland | 99.9 /100 | #45 | Exceptional 11.5% |
| Immigrants | Bulgaria | 99.9 /100 | #46 | Exceptional 11.6% |
| Nepalese | 99.9 /100 | #47 | Exceptional 11.6% |
| Immigrants | Indonesia | 99.9 /100 | #48 | Exceptional 11.6% |
| Tlingit-Haida | 99.9 /100 | #49 | Exceptional 11.6% |
| Immigrants | Lithuania | 99.9 /100 | #50 | Exceptional 11.6% |
| Paraguayans | 99.9 /100 | #51 | Exceptional 11.6% |
| Samoans | 99.9 /100 | #52 | Exceptional 11.7% |
| Bulgarians | 99.9 /100 | #53 | Exceptional 11.7% |
| Immigrants | Uzbekistan | 99.9 /100 | #54 | Exceptional 11.7% |