Greek vs Venezuelan Male Poverty
COMPARE
Greek
Venezuelan
Male Poverty
Male Poverty Comparison
Greeks
Venezuelans
9.7%
MALE POVERTY
99.6/ 100
METRIC RATING
29th/ 347
METRIC RANK
11.0%
MALE POVERTY
67.4/ 100
METRIC RATING
151st/ 347
METRIC RANK
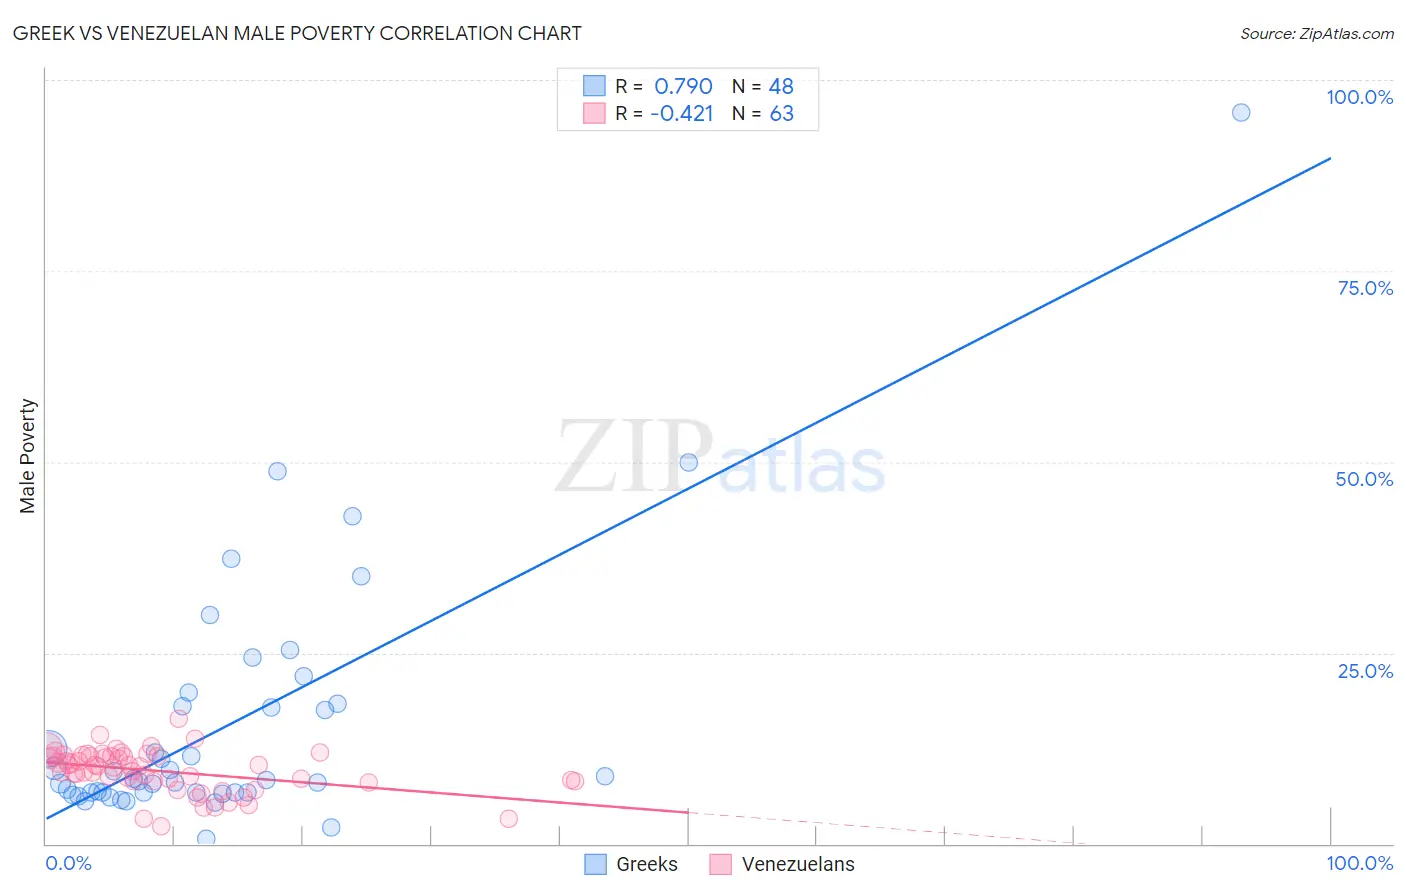
Greek vs Venezuelan Male Poverty Correlation Chart
The statistical analysis conducted on geographies consisting of 481,993,852 people shows a strong positive correlation between the proportion of Greeks and poverty level among males in the United States with a correlation coefficient (R) of 0.790 and weighted average of 9.7%. Similarly, the statistical analysis conducted on geographies consisting of 305,957,955 people shows a moderate negative correlation between the proportion of Venezuelans and poverty level among males in the United States with a correlation coefficient (R) of -0.421 and weighted average of 11.0%, a difference of 13.2%.
Male Poverty Correlation Summary
| Measurement | Greek | Venezuelan |
| Minimum | 0.65% | 2.3% |
| Maximum | 95.7% | 16.3% |
| Range | 95.1% | 14.0% |
| Mean | 15.6% | 9.5% |
| Median | 8.4% | 10.1% |
| Interquartile 25% (IQ1) | 6.7% | 8.2% |
| Interquartile 75% (IQ3) | 18.1% | 11.5% |
| Interquartile Range (IQR) | 11.4% | 3.3% |
| Standard Deviation (Sample) | 16.7% | 2.8% |
| Standard Deviation (Population) | 16.5% | 2.7% |
Similar Demographics by Male Poverty
Demographics Similar to Greeks by Male Poverty
In terms of male poverty, the demographic groups most similar to Greeks are Immigrants from Korea (9.7%, a difference of 0.040%), Polish (9.7%, a difference of 0.080%), Tongan (9.7%, a difference of 0.10%), Danish (9.7%, a difference of 0.12%), and Burmese (9.7%, a difference of 0.25%).
| Demographics | Rating | Rank | Male Poverty |
| Croatians | 99.7 /100 | #22 | Exceptional 9.6% |
| Italians | 99.7 /100 | #23 | Exceptional 9.6% |
| Swedes | 99.7 /100 | #24 | Exceptional 9.6% |
| Eastern Europeans | 99.6 /100 | #25 | Exceptional 9.6% |
| Burmese | 99.6 /100 | #26 | Exceptional 9.7% |
| Danes | 99.6 /100 | #27 | Exceptional 9.7% |
| Immigrants | Korea | 99.6 /100 | #28 | Exceptional 9.7% |
| Greeks | 99.6 /100 | #29 | Exceptional 9.7% |
| Poles | 99.5 /100 | #30 | Exceptional 9.7% |
| Tongans | 99.5 /100 | #31 | Exceptional 9.7% |
| Macedonians | 99.5 /100 | #32 | Exceptional 9.7% |
| Immigrants | Northern Europe | 99.5 /100 | #33 | Exceptional 9.7% |
| Immigrants | Poland | 99.5 /100 | #34 | Exceptional 9.8% |
| Iranians | 99.4 /100 | #35 | Exceptional 9.8% |
| Czechs | 99.4 /100 | #36 | Exceptional 9.8% |
Demographics Similar to Venezuelans by Male Poverty
In terms of male poverty, the demographic groups most similar to Venezuelans are Immigrants from Nepal (11.0%, a difference of 0.0%), Guamanian/Chamorro (11.0%, a difference of 0.020%), Immigrants from Venezuela (11.0%, a difference of 0.060%), Armenian (11.0%, a difference of 0.080%), and Icelander (11.0%, a difference of 0.13%).
| Demographics | Rating | Rank | Male Poverty |
| Samoans | 71.8 /100 | #144 | Good 10.9% |
| Immigrants | Germany | 71.6 /100 | #145 | Good 10.9% |
| Syrians | 71.4 /100 | #146 | Good 10.9% |
| Icelanders | 68.5 /100 | #147 | Good 11.0% |
| Armenians | 68.0 /100 | #148 | Good 11.0% |
| Immigrants | Venezuela | 67.9 /100 | #149 | Good 11.0% |
| Guamanians/Chamorros | 67.6 /100 | #150 | Good 11.0% |
| Venezuelans | 67.4 /100 | #151 | Good 11.0% |
| Immigrants | Nepal | 67.3 /100 | #152 | Good 11.0% |
| Immigrants | Bosnia and Herzegovina | 65.2 /100 | #153 | Good 11.0% |
| Immigrants | Kazakhstan | 64.8 /100 | #154 | Good 11.0% |
| Immigrants | Malaysia | 64.7 /100 | #155 | Good 11.0% |
| Costa Ricans | 63.9 /100 | #156 | Good 11.0% |
| Scotch-Irish | 63.7 /100 | #157 | Good 11.0% |
| Colombians | 63.0 /100 | #158 | Good 11.0% |