Guamanian/Chamorro vs Immigrants from Korea Married-Couple Family Poverty
COMPARE
Guamanian/Chamorro
Immigrants from Korea
Married-Couple Family Poverty
Married-Couple Family Poverty Comparison
Guamanians/Chamorros
Immigrants from Korea
4.9%
MARRIED-COUPLE FAMILY POVERTY
86.5/ 100
METRIC RATING
137th/ 347
METRIC RANK
4.5%
MARRIED-COUPLE FAMILY POVERTY
99.4/ 100
METRIC RATING
70th/ 347
METRIC RANK
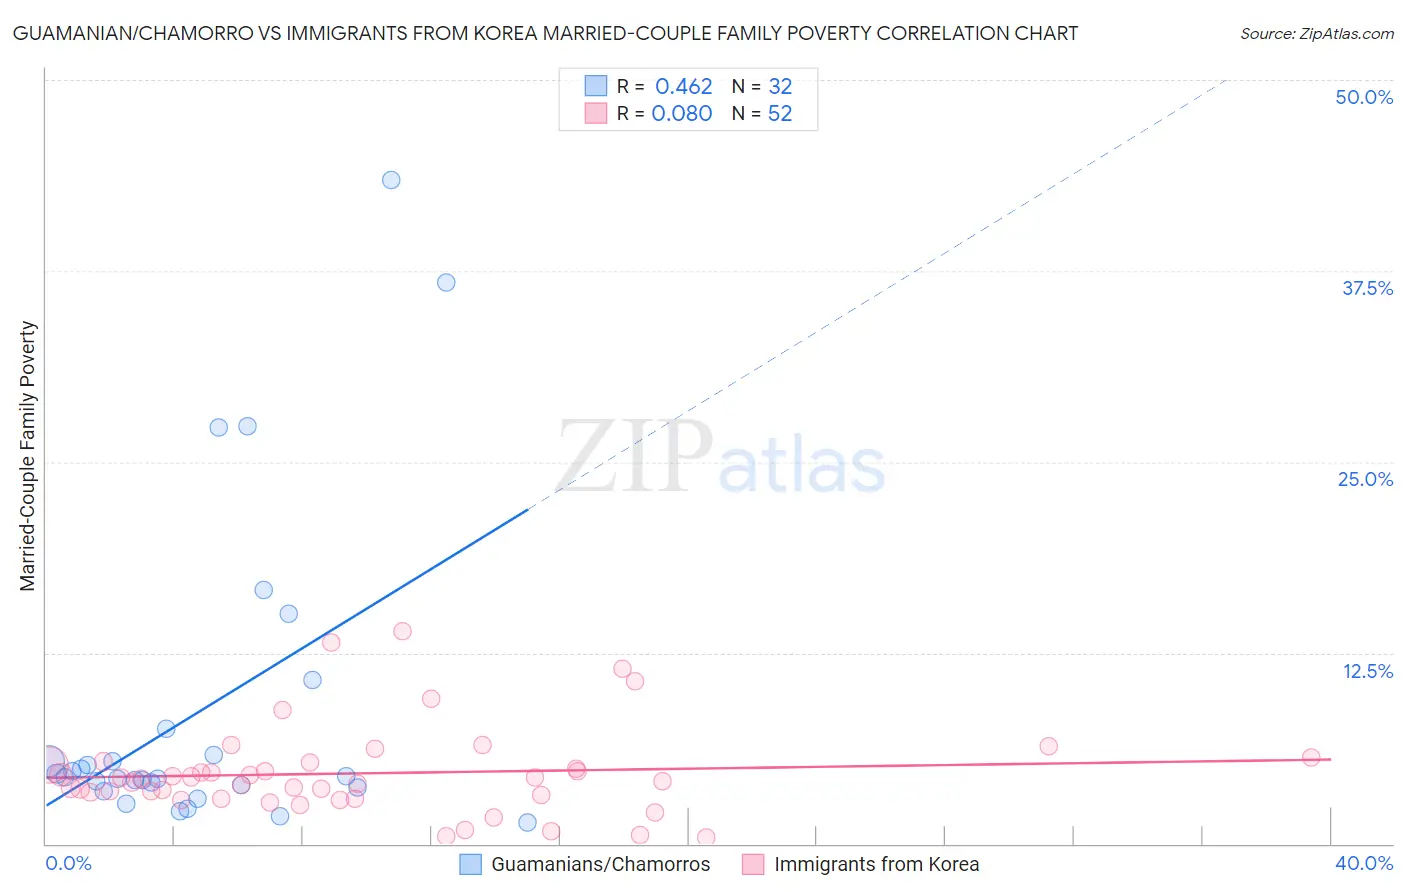
Guamanian/Chamorro vs Immigrants from Korea Married-Couple Family Poverty Correlation Chart
The statistical analysis conducted on geographies consisting of 221,186,731 people shows a moderate positive correlation between the proportion of Guamanians/Chamorros and poverty level among married-couple families in the United States with a correlation coefficient (R) of 0.462 and weighted average of 4.9%. Similarly, the statistical analysis conducted on geographies consisting of 411,729,452 people shows a slight positive correlation between the proportion of Immigrants from Korea and poverty level among married-couple families in the United States with a correlation coefficient (R) of 0.080 and weighted average of 4.5%, a difference of 10.9%.
Married-Couple Family Poverty Correlation Summary
| Measurement | Guamanian/Chamorro | Immigrants from Korea |
| Minimum | 1.4% | 0.39% |
| Maximum | 43.5% | 13.9% |
| Range | 42.0% | 13.5% |
| Mean | 8.7% | 4.6% |
| Median | 4.4% | 4.2% |
| Interquartile 25% (IQ1) | 3.8% | 3.1% |
| Interquartile 75% (IQ3) | 6.7% | 5.3% |
| Interquartile Range (IQR) | 2.9% | 2.2% |
| Standard Deviation (Sample) | 10.4% | 2.9% |
| Standard Deviation (Population) | 10.3% | 2.9% |
Similar Demographics by Married-Couple Family Poverty
Demographics Similar to Guamanians/Chamorros by Married-Couple Family Poverty
In terms of married-couple family poverty, the demographic groups most similar to Guamanians/Chamorros are Chilean (4.9%, a difference of 0.13%), German Russian (5.0%, a difference of 0.36%), Immigrants from Portugal (5.0%, a difference of 0.42%), Immigrants from Brazil (5.0%, a difference of 0.47%), and Immigrants from China (5.0%, a difference of 0.47%).
| Demographics | Rating | Rank | Married-Couple Family Poverty |
| Soviet Union | 90.7 /100 | #130 | Exceptional 4.9% |
| Immigrants | Eastern Europe | 90.5 /100 | #131 | Exceptional 4.9% |
| Puget Sound Salish | 90.4 /100 | #132 | Exceptional 4.9% |
| Immigrants | Kenya | 90.2 /100 | #133 | Exceptional 4.9% |
| Samoans | 90.2 /100 | #134 | Exceptional 4.9% |
| Assyrians/Chaldeans/Syriacs | 89.4 /100 | #135 | Excellent 4.9% |
| Immigrants | Hungary | 88.7 /100 | #136 | Excellent 4.9% |
| Guamanians/Chamorros | 86.5 /100 | #137 | Excellent 4.9% |
| Chileans | 86.0 /100 | #138 | Excellent 4.9% |
| German Russians | 85.1 /100 | #139 | Excellent 5.0% |
| Immigrants | Portugal | 84.8 /100 | #140 | Excellent 5.0% |
| Immigrants | Brazil | 84.6 /100 | #141 | Excellent 5.0% |
| Immigrants | China | 84.6 /100 | #142 | Excellent 5.0% |
| Immigrants | Egypt | 83.4 /100 | #143 | Excellent 5.0% |
| Hmong | 83.2 /100 | #144 | Excellent 5.0% |
Demographics Similar to Immigrants from Korea by Married-Couple Family Poverty
In terms of married-couple family poverty, the demographic groups most similar to Immigrants from Korea are New Zealander (4.4%, a difference of 0.13%), Slavic (4.4%, a difference of 0.14%), Immigrants from Canada (4.4%, a difference of 0.16%), Immigrants from Serbia (4.4%, a difference of 0.20%), and Macedonian (4.4%, a difference of 0.34%).
| Demographics | Rating | Rank | Married-Couple Family Poverty |
| Immigrants | Sri Lanka | 99.6 /100 | #63 | Exceptional 4.4% |
| Immigrants | Bulgaria | 99.5 /100 | #64 | Exceptional 4.4% |
| Macedonians | 99.4 /100 | #65 | Exceptional 4.4% |
| Immigrants | Serbia | 99.4 /100 | #66 | Exceptional 4.4% |
| Immigrants | Canada | 99.4 /100 | #67 | Exceptional 4.4% |
| Slavs | 99.4 /100 | #68 | Exceptional 4.4% |
| New Zealanders | 99.4 /100 | #69 | Exceptional 4.4% |
| Immigrants | Korea | 99.4 /100 | #70 | Exceptional 4.5% |
| Immigrants | North America | 99.3 /100 | #71 | Exceptional 4.5% |
| Immigrants | England | 99.3 /100 | #72 | Exceptional 4.5% |
| Ukrainians | 99.2 /100 | #73 | Exceptional 4.5% |
| Immigrants | Austria | 99.2 /100 | #74 | Exceptional 4.5% |
| Cambodians | 99.2 /100 | #75 | Exceptional 4.5% |
| Immigrants | South Africa | 99.1 /100 | #76 | Exceptional 4.5% |
| Immigrants | Latvia | 99.1 /100 | #77 | Exceptional 4.5% |