Guatemalan vs Immigrants from Middle Africa Single Male Poverty
COMPARE
Guatemalan
Immigrants from Middle Africa
Single Male Poverty
Single Male Poverty Comparison
Guatemalans
Immigrants from Middle Africa
13.8%
SINGLE MALE POVERTY
0.3/ 100
METRIC RATING
259th/ 347
METRIC RANK
12.7%
SINGLE MALE POVERTY
64.9/ 100
METRIC RATING
158th/ 347
METRIC RANK
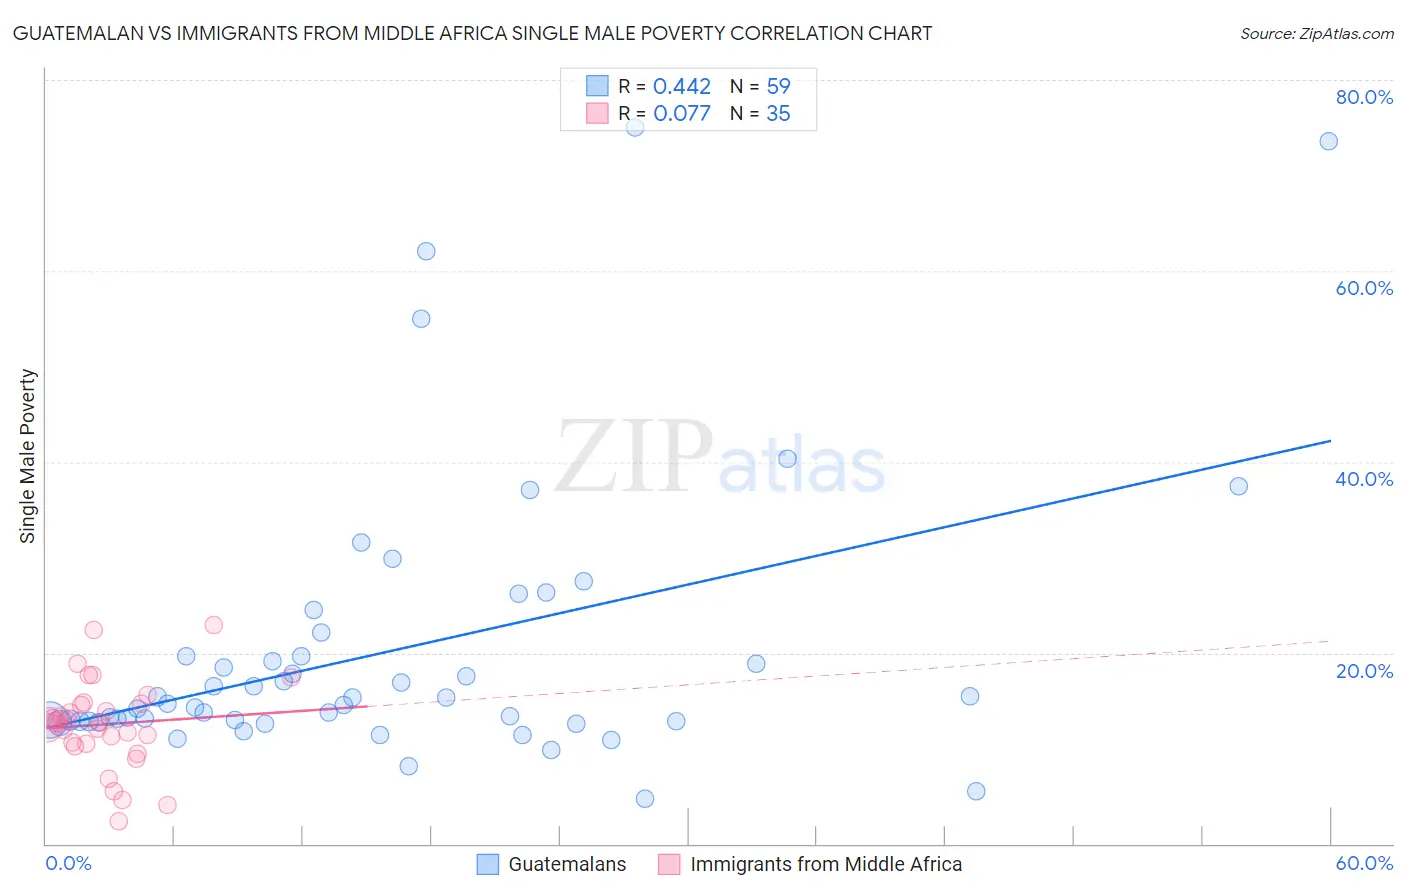
Guatemalan vs Immigrants from Middle Africa Single Male Poverty Correlation Chart
The statistical analysis conducted on geographies consisting of 366,968,196 people shows a moderate positive correlation between the proportion of Guatemalans and poverty level among single males in the United States with a correlation coefficient (R) of 0.442 and weighted average of 13.8%. Similarly, the statistical analysis conducted on geographies consisting of 190,434,572 people shows a slight positive correlation between the proportion of Immigrants from Middle Africa and poverty level among single males in the United States with a correlation coefficient (R) of 0.077 and weighted average of 12.7%, a difference of 8.4%.
Single Male Poverty Correlation Summary
| Measurement | Guatemalan | Immigrants from Middle Africa |
| Minimum | 4.7% | 2.3% |
| Maximum | 75.0% | 22.9% |
| Range | 70.3% | 20.5% |
| Mean | 20.2% | 12.5% |
| Median | 14.7% | 12.7% |
| Interquartile 25% (IQ1) | 12.8% | 10.5% |
| Interquartile 75% (IQ3) | 19.7% | 14.6% |
| Interquartile Range (IQR) | 6.9% | 4.1% |
| Standard Deviation (Sample) | 14.7% | 4.6% |
| Standard Deviation (Population) | 14.5% | 4.5% |
Similar Demographics by Single Male Poverty
Demographics Similar to Guatemalans by Single Male Poverty
In terms of single male poverty, the demographic groups most similar to Guatemalans are Immigrants from Guatemala (13.8%, a difference of 0.040%), Swiss (13.8%, a difference of 0.070%), Immigrants from Central America (13.8%, a difference of 0.11%), Hungarian (13.8%, a difference of 0.12%), and Immigrants from Belize (13.7%, a difference of 0.29%).
| Demographics | Rating | Rank | Single Male Poverty |
| Finns | 0.9 /100 | #252 | Tragic 13.6% |
| German Russians | 0.8 /100 | #253 | Tragic 13.6% |
| Sub-Saharan Africans | 0.5 /100 | #254 | Tragic 13.7% |
| Spaniards | 0.4 /100 | #255 | Tragic 13.7% |
| Immigrants | Belize | 0.4 /100 | #256 | Tragic 13.7% |
| Immigrants | Central America | 0.3 /100 | #257 | Tragic 13.8% |
| Immigrants | Guatemala | 0.3 /100 | #258 | Tragic 13.8% |
| Guatemalans | 0.3 /100 | #259 | Tragic 13.8% |
| Swiss | 0.3 /100 | #260 | Tragic 13.8% |
| Hungarians | 0.3 /100 | #261 | Tragic 13.8% |
| Fijians | 0.3 /100 | #262 | Tragic 13.8% |
| Cape Verdeans | 0.2 /100 | #263 | Tragic 13.8% |
| West Indians | 0.2 /100 | #264 | Tragic 13.8% |
| Immigrants | Congo | 0.2 /100 | #265 | Tragic 13.9% |
| Immigrants | Cabo Verde | 0.1 /100 | #266 | Tragic 13.9% |
Demographics Similar to Immigrants from Middle Africa by Single Male Poverty
In terms of single male poverty, the demographic groups most similar to Immigrants from Middle Africa are Immigrants from Liberia (12.7%, a difference of 0.040%), Greek (12.7%, a difference of 0.040%), Immigrants from Africa (12.7%, a difference of 0.080%), Eastern European (12.7%, a difference of 0.090%), and Palestinian (12.7%, a difference of 0.10%).
| Demographics | Rating | Rank | Single Male Poverty |
| Immigrants | Hungary | 71.9 /100 | #151 | Good 12.6% |
| Australians | 71.4 /100 | #152 | Good 12.6% |
| Immigrants | Immigrants | 70.1 /100 | #153 | Good 12.7% |
| Immigrants | Scotland | 68.9 /100 | #154 | Good 12.7% |
| Immigrants | Spain | 68.7 /100 | #155 | Good 12.7% |
| Vietnamese | 67.9 /100 | #156 | Good 12.7% |
| Latvians | 67.9 /100 | #157 | Good 12.7% |
| Immigrants | Middle Africa | 64.9 /100 | #158 | Good 12.7% |
| Immigrants | Liberia | 64.2 /100 | #159 | Good 12.7% |
| Greeks | 64.1 /100 | #160 | Good 12.7% |
| Immigrants | Africa | 63.4 /100 | #161 | Good 12.7% |
| Eastern Europeans | 63.3 /100 | #162 | Good 12.7% |
| Palestinians | 63.1 /100 | #163 | Good 12.7% |
| Immigrants | Nigeria | 62.8 /100 | #164 | Good 12.7% |
| Immigrants | Cambodia | 62.2 /100 | #165 | Good 12.7% |