Hawaiian vs American Single Father Poverty
COMPARE
Hawaiian
American
Single Father Poverty
Single Father Poverty Comparison
Hawaiians
Americans
15.1%
SINGLE FATHER POVERTY
99.9/ 100
METRIC RATING
58th/ 347
METRIC RANK
20.1%
SINGLE FATHER POVERTY
0.0/ 100
METRIC RATING
324th/ 347
METRIC RANK
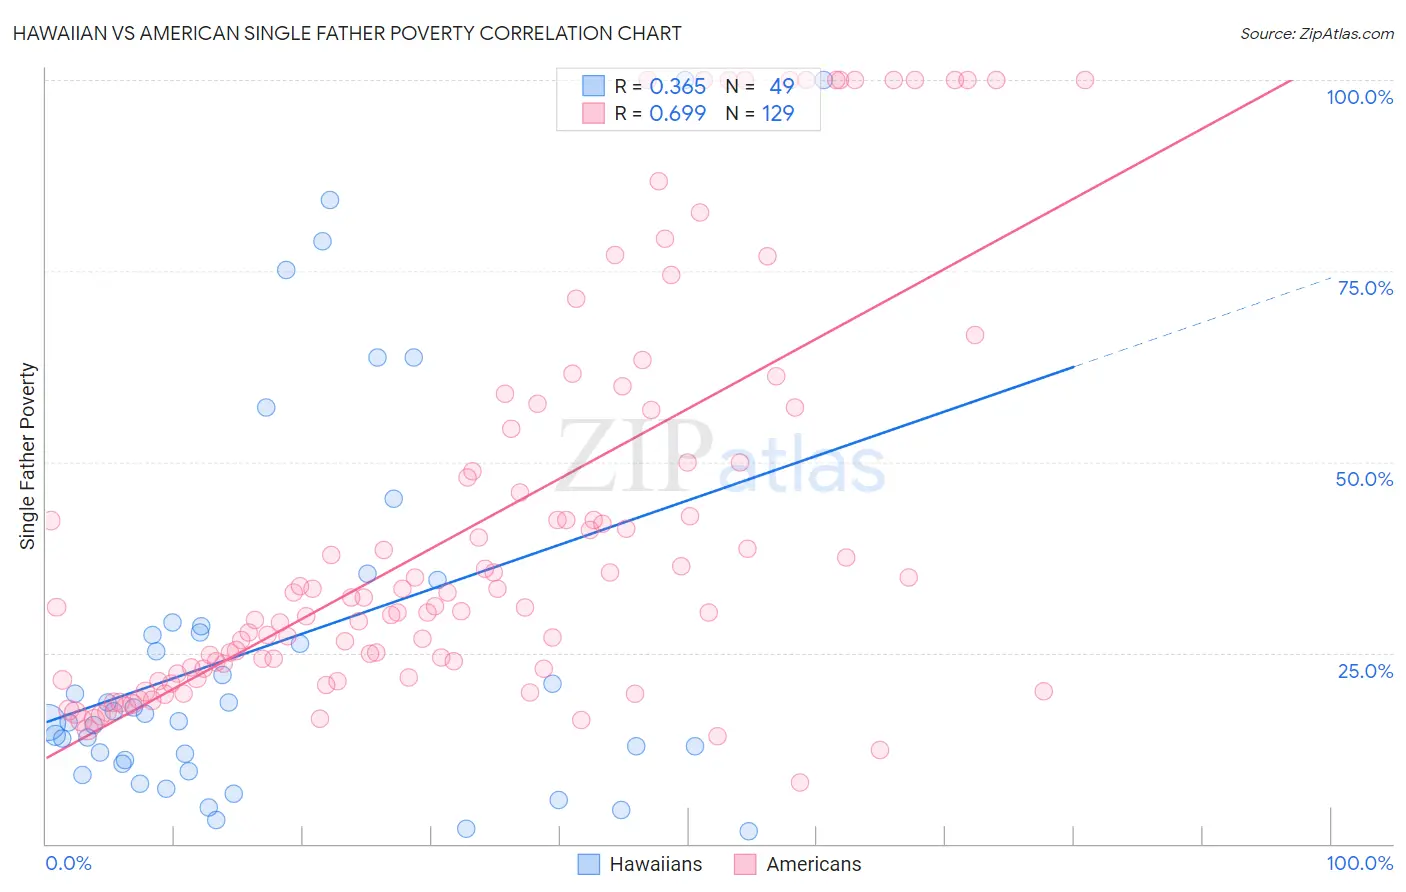
Hawaiian vs American Single Father Poverty Correlation Chart
The statistical analysis conducted on geographies consisting of 272,607,469 people shows a mild positive correlation between the proportion of Hawaiians and poverty level among single fathers in the United States with a correlation coefficient (R) of 0.365 and weighted average of 15.1%. Similarly, the statistical analysis conducted on geographies consisting of 414,003,913 people shows a significant positive correlation between the proportion of Americans and poverty level among single fathers in the United States with a correlation coefficient (R) of 0.699 and weighted average of 20.1%, a difference of 33.0%.
Single Father Poverty Correlation Summary
| Measurement | Hawaiian | American |
| Minimum | 1.7% | 8.0% |
| Maximum | 100.0% | 100.0% |
| Range | 98.3% | 92.0% |
| Mean | 26.3% | 41.6% |
| Median | 17.0% | 31.1% |
| Interquartile 25% (IQ1) | 10.7% | 22.6% |
| Interquartile 75% (IQ3) | 28.7% | 52.2% |
| Interquartile Range (IQR) | 18.0% | 29.6% |
| Standard Deviation (Sample) | 25.4% | 26.6% |
| Standard Deviation (Population) | 25.2% | 26.5% |
Similar Demographics by Single Father Poverty
Demographics Similar to Hawaiians by Single Father Poverty
In terms of single father poverty, the demographic groups most similar to Hawaiians are Laotian (15.1%, a difference of 0.060%), Guamanian/Chamorro (15.1%, a difference of 0.10%), Immigrants from Laos (15.1%, a difference of 0.14%), Immigrants from Bulgaria (15.0%, a difference of 0.42%), and Immigrants from Uzbekistan (15.0%, a difference of 0.47%).
| Demographics | Rating | Rank | Single Father Poverty |
| Immigrants | Pakistan | 99.9 /100 | #51 | Exceptional 15.0% |
| Immigrants | El Salvador | 99.9 /100 | #52 | Exceptional 15.0% |
| Immigrants | Kenya | 99.9 /100 | #53 | Exceptional 15.0% |
| Immigrants | Uzbekistan | 99.9 /100 | #54 | Exceptional 15.0% |
| Immigrants | Bulgaria | 99.9 /100 | #55 | Exceptional 15.0% |
| Immigrants | Laos | 99.9 /100 | #56 | Exceptional 15.1% |
| Laotians | 99.9 /100 | #57 | Exceptional 15.1% |
| Hawaiians | 99.9 /100 | #58 | Exceptional 15.1% |
| Guamanians/Chamorros | 99.9 /100 | #59 | Exceptional 15.1% |
| Puget Sound Salish | 99.8 /100 | #60 | Exceptional 15.2% |
| Immigrants | Bosnia and Herzegovina | 99.8 /100 | #61 | Exceptional 15.2% |
| Immigrants | Armenia | 99.8 /100 | #62 | Exceptional 15.2% |
| Immigrants | Sweden | 99.8 /100 | #63 | Exceptional 15.2% |
| Bangladeshis | 99.8 /100 | #64 | Exceptional 15.2% |
| Immigrants | Malaysia | 99.8 /100 | #65 | Exceptional 15.2% |
Demographics Similar to Americans by Single Father Poverty
In terms of single father poverty, the demographic groups most similar to Americans are Pennsylvania German (20.0%, a difference of 0.22%), Creek (19.8%, a difference of 1.1%), Black/African American (20.4%, a difference of 1.6%), Cherokee (19.6%, a difference of 2.1%), and Immigrants from Yemen (20.6%, a difference of 2.6%).
| Demographics | Rating | Rank | Single Father Poverty |
| Dominicans | 0.0 /100 | #317 | Tragic 19.1% |
| Dutch West Indians | 0.0 /100 | #318 | Tragic 19.2% |
| Slovaks | 0.0 /100 | #319 | Tragic 19.3% |
| Inupiat | 0.0 /100 | #320 | Tragic 19.5% |
| Cherokee | 0.0 /100 | #321 | Tragic 19.6% |
| Creek | 0.0 /100 | #322 | Tragic 19.8% |
| Pennsylvania Germans | 0.0 /100 | #323 | Tragic 20.0% |
| Americans | 0.0 /100 | #324 | Tragic 20.1% |
| Blacks/African Americans | 0.0 /100 | #325 | Tragic 20.4% |
| Immigrants | Yemen | 0.0 /100 | #326 | Tragic 20.6% |
| Choctaw | 0.0 /100 | #327 | Tragic 20.7% |
| Pueblo | 0.0 /100 | #328 | Tragic 21.1% |
| Colville | 0.0 /100 | #329 | Tragic 21.4% |
| Paiute | 0.0 /100 | #330 | Tragic 21.6% |
| Central American Indians | 0.0 /100 | #331 | Tragic 21.7% |