Hungarian vs Immigrants from Burma/Myanmar Male Poverty
COMPARE
Hungarian
Immigrants from Burma/Myanmar
Male Poverty
Male Poverty Comparison
Hungarians
Immigrants from Burma/Myanmar
11.1%
MALE POVERTY
55.1/ 100
METRIC RATING
167th/ 347
METRIC RANK
13.0%
MALE POVERTY
0.1/ 100
METRIC RATING
256th/ 347
METRIC RANK
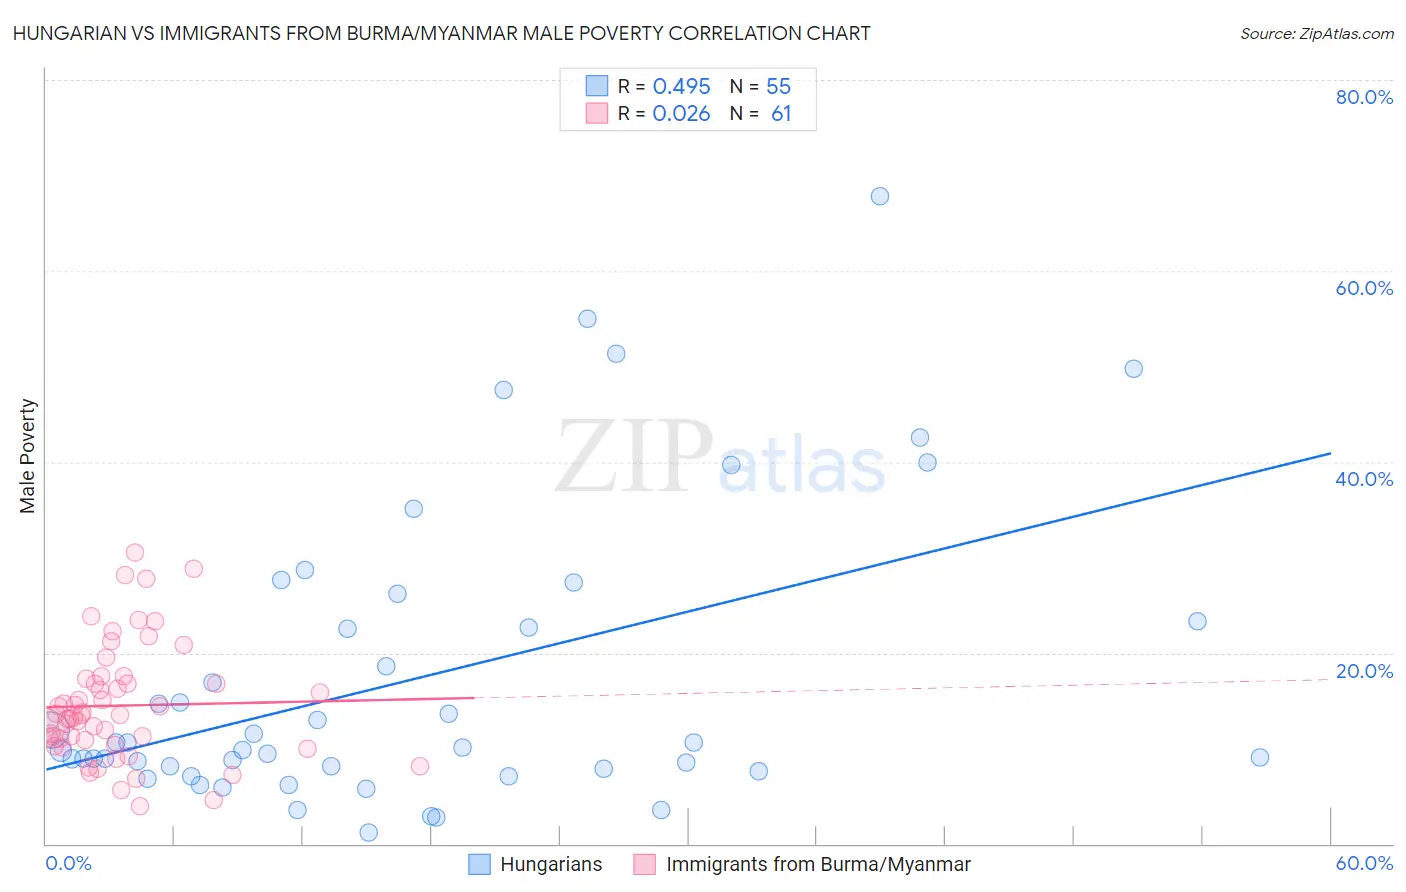
Hungarian vs Immigrants from Burma/Myanmar Male Poverty Correlation Chart
The statistical analysis conducted on geographies consisting of 485,483,073 people shows a moderate positive correlation between the proportion of Hungarians and poverty level among males in the United States with a correlation coefficient (R) of 0.495 and weighted average of 11.1%. Similarly, the statistical analysis conducted on geographies consisting of 172,258,093 people shows no correlation between the proportion of Immigrants from Burma/Myanmar and poverty level among males in the United States with a correlation coefficient (R) of 0.026 and weighted average of 13.0%, a difference of 17.0%.
Male Poverty Correlation Summary
| Measurement | Hungarian | Immigrants from Burma/Myanmar |
| Minimum | 1.2% | 3.9% |
| Maximum | 67.8% | 30.5% |
| Range | 66.6% | 26.6% |
| Mean | 17.3% | 14.5% |
| Median | 10.1% | 13.5% |
| Interquartile 25% (IQ1) | 7.8% | 10.6% |
| Interquartile 75% (IQ3) | 23.3% | 17.0% |
| Interquartile Range (IQR) | 15.4% | 6.5% |
| Standard Deviation (Sample) | 15.4% | 6.0% |
| Standard Deviation (Population) | 15.3% | 5.9% |
Similar Demographics by Male Poverty
Demographics Similar to Hungarians by Male Poverty
In terms of male poverty, the demographic groups most similar to Hungarians are Immigrants from Albania (11.1%, a difference of 0.020%), Immigrants from Portugal (11.1%, a difference of 0.020%), Immigrants from Spain (11.1%, a difference of 0.040%), Immigrants from Colombia (11.1%, a difference of 0.090%), and South American (11.1%, a difference of 0.14%).
| Demographics | Rating | Rank | Male Poverty |
| Soviet Union | 60.3 /100 | #160 | Good 11.1% |
| Immigrants | Northern Africa | 59.7 /100 | #161 | Average 11.1% |
| Immigrants | Chile | 57.4 /100 | #162 | Average 11.1% |
| Whites/Caucasians | 56.7 /100 | #163 | Average 11.1% |
| Ethiopians | 56.7 /100 | #164 | Average 11.1% |
| Immigrants | Spain | 55.5 /100 | #165 | Average 11.1% |
| Immigrants | Albania | 55.3 /100 | #166 | Average 11.1% |
| Hungarians | 55.1 /100 | #167 | Average 11.1% |
| Immigrants | Portugal | 54.9 /100 | #168 | Average 11.1% |
| Immigrants | Colombia | 54.2 /100 | #169 | Average 11.1% |
| South Americans | 53.8 /100 | #170 | Average 11.1% |
| Uruguayans | 51.0 /100 | #171 | Average 11.2% |
| Immigrants | Ethiopia | 50.7 /100 | #172 | Average 11.2% |
| Pennsylvania Germans | 50.5 /100 | #173 | Average 11.2% |
| Immigrants | Oceania | 50.0 /100 | #174 | Average 11.2% |
Demographics Similar to Immigrants from Burma/Myanmar by Male Poverty
In terms of male poverty, the demographic groups most similar to Immigrants from Burma/Myanmar are Immigrants from Liberia (13.0%, a difference of 0.20%), Immigrants from Trinidad and Tobago (13.1%, a difference of 0.26%), Mexican American Indian (13.0%, a difference of 0.29%), Cape Verdean (13.1%, a difference of 0.39%), and Cherokee (13.1%, a difference of 0.55%).
| Demographics | Rating | Rank | Male Poverty |
| Potawatomi | 0.2 /100 | #249 | Tragic 12.9% |
| Immigrants | Nicaragua | 0.2 /100 | #250 | Tragic 12.9% |
| Immigrants | Cuba | 0.2 /100 | #251 | Tragic 12.9% |
| Immigrants | Ecuador | 0.2 /100 | #252 | Tragic 12.9% |
| Immigrants | Ghana | 0.2 /100 | #253 | Tragic 12.9% |
| Mexican American Indians | 0.1 /100 | #254 | Tragic 13.0% |
| Immigrants | Liberia | 0.1 /100 | #255 | Tragic 13.0% |
| Immigrants | Burma/Myanmar | 0.1 /100 | #256 | Tragic 13.0% |
| Immigrants | Trinidad and Tobago | 0.1 /100 | #257 | Tragic 13.1% |
| Cape Verdeans | 0.1 /100 | #258 | Tragic 13.1% |
| Cherokee | 0.1 /100 | #259 | Tragic 13.1% |
| Ottawa | 0.1 /100 | #260 | Tragic 13.1% |
| Trinidadians and Tobagonians | 0.1 /100 | #261 | Tragic 13.1% |
| Spanish American Indians | 0.1 /100 | #262 | Tragic 13.1% |
| Central Americans | 0.1 /100 | #263 | Tragic 13.2% |