Immigrants from Argentina vs New Zealander Child Poverty Under the Age of 5
COMPARE
Immigrants from Argentina
New Zealander
Child Poverty Under the Age of 5
Child Poverty Under the Age of 5 Comparison
Immigrants from Argentina
New Zealanders
15.4%
CHILD POVERTY UNDER THE AGE OF 5
98.5/ 100
METRIC RATING
75th/ 347
METRIC RANK
16.6%
CHILD POVERTY UNDER THE AGE OF 5
78.7/ 100
METRIC RATING
149th/ 347
METRIC RANK
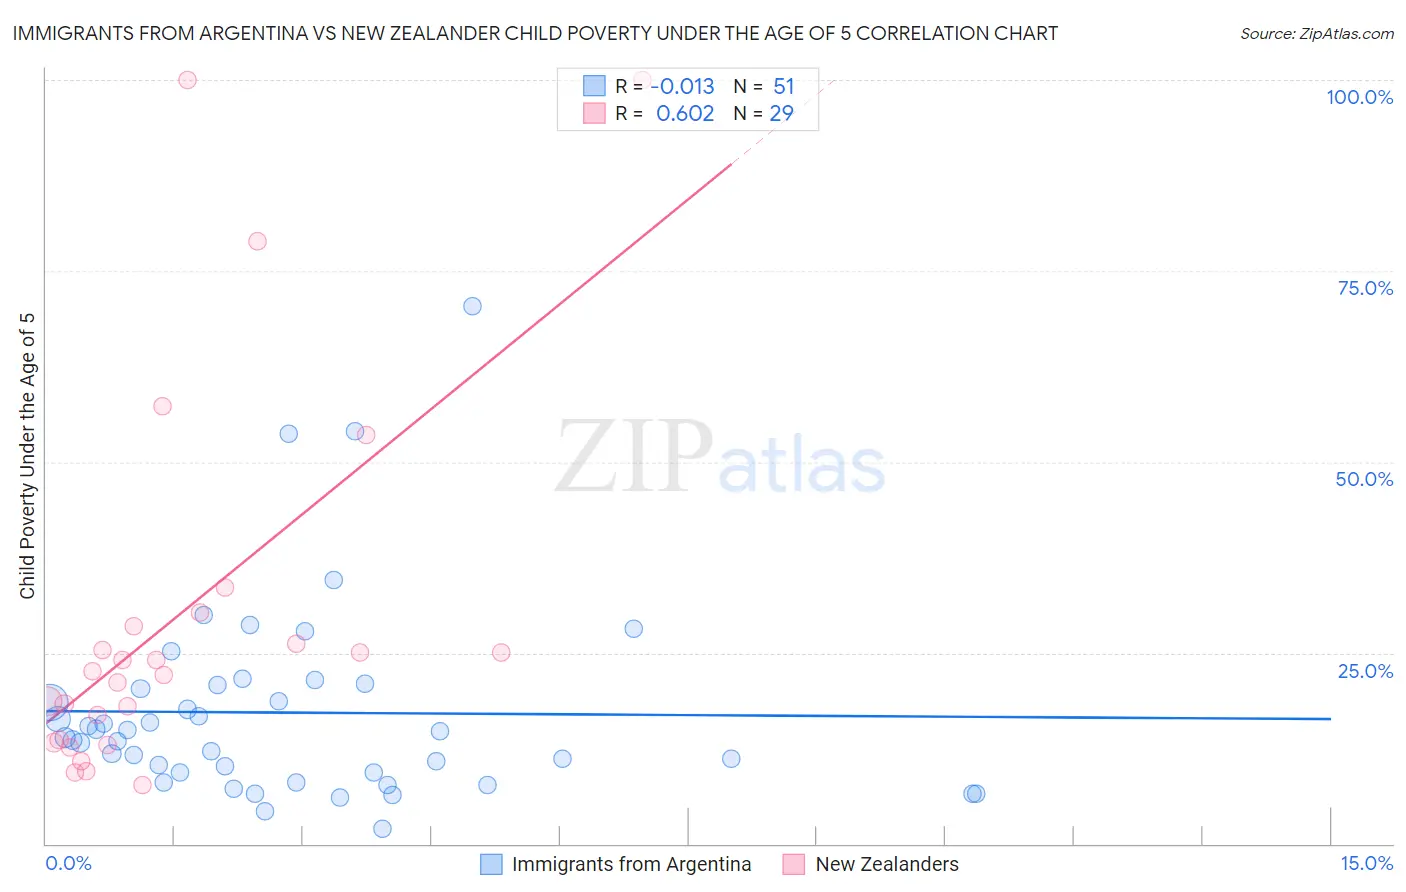
Immigrants from Argentina vs New Zealander Child Poverty Under the Age of 5 Correlation Chart
The statistical analysis conducted on geographies consisting of 256,145,971 people shows no correlation between the proportion of Immigrants from Argentina and poverty level among children under the age of 5 in the United States with a correlation coefficient (R) of -0.013 and weighted average of 15.4%. Similarly, the statistical analysis conducted on geographies consisting of 105,110,769 people shows a significant positive correlation between the proportion of New Zealanders and poverty level among children under the age of 5 in the United States with a correlation coefficient (R) of 0.602 and weighted average of 16.6%, a difference of 8.3%.
Child Poverty Under the Age of 5 Correlation Summary
| Measurement | Immigrants from Argentina | New Zealander |
| Minimum | 2.0% | 7.7% |
| Maximum | 70.4% | 100.0% |
| Range | 68.4% | 92.3% |
| Mean | 17.2% | 29.6% |
| Median | 13.9% | 22.7% |
| Interquartile 25% (IQ1) | 9.3% | 13.4% |
| Interquartile 75% (IQ3) | 20.8% | 29.4% |
| Interquartile Range (IQR) | 11.5% | 16.0% |
| Standard Deviation (Sample) | 13.0% | 24.8% |
| Standard Deviation (Population) | 12.9% | 24.4% |
Similar Demographics by Child Poverty Under the Age of 5
Demographics Similar to Immigrants from Argentina by Child Poverty Under the Age of 5
In terms of child poverty under the age of 5, the demographic groups most similar to Immigrants from Argentina are Croatian (15.4%, a difference of 0.0%), Argentinean (15.4%, a difference of 0.15%), Immigrants from Turkey (15.4%, a difference of 0.21%), Immigrants from Ukraine (15.3%, a difference of 0.51%), and Sri Lankan (15.5%, a difference of 0.54%).
| Demographics | Rating | Rank | Child Poverty Under the Age of 5 |
| Zimbabweans | 99.0 /100 | #68 | Exceptional 15.2% |
| Lithuanians | 99.0 /100 | #69 | Exceptional 15.2% |
| Immigrants | Belgium | 98.8 /100 | #70 | Exceptional 15.3% |
| Immigrants | Egypt | 98.8 /100 | #71 | Exceptional 15.3% |
| Immigrants | Sweden | 98.8 /100 | #72 | Exceptional 15.3% |
| Immigrants | Ukraine | 98.7 /100 | #73 | Exceptional 15.3% |
| Argentineans | 98.5 /100 | #74 | Exceptional 15.4% |
| Immigrants | Argentina | 98.5 /100 | #75 | Exceptional 15.4% |
| Croatians | 98.5 /100 | #76 | Exceptional 15.4% |
| Immigrants | Turkey | 98.3 /100 | #77 | Exceptional 15.4% |
| Sri Lankans | 98.1 /100 | #78 | Exceptional 15.5% |
| Australians | 98.0 /100 | #79 | Exceptional 15.5% |
| Italians | 97.9 /100 | #80 | Exceptional 15.5% |
| Czechs | 97.8 /100 | #81 | Exceptional 15.5% |
| Immigrants | Italy | 97.7 /100 | #82 | Exceptional 15.6% |
Demographics Similar to New Zealanders by Child Poverty Under the Age of 5
In terms of child poverty under the age of 5, the demographic groups most similar to New Zealanders are Syrian (16.6%, a difference of 0.060%), Colombian (16.7%, a difference of 0.14%), Canadian (16.7%, a difference of 0.17%), Belgian (16.7%, a difference of 0.24%), and Immigrants from Nepal (16.6%, a difference of 0.25%).
| Demographics | Rating | Rank | Child Poverty Under the Age of 5 |
| Portuguese | 83.0 /100 | #142 | Excellent 16.5% |
| Samoans | 83.0 /100 | #143 | Excellent 16.5% |
| Ethiopians | 82.7 /100 | #144 | Excellent 16.5% |
| Immigrants | Ethiopia | 82.1 /100 | #145 | Excellent 16.6% |
| Israelis | 82.0 /100 | #146 | Excellent 16.6% |
| Immigrants | Nepal | 80.3 /100 | #147 | Excellent 16.6% |
| Syrians | 79.1 /100 | #148 | Good 16.6% |
| New Zealanders | 78.7 /100 | #149 | Good 16.6% |
| Colombians | 77.8 /100 | #150 | Good 16.7% |
| Canadians | 77.6 /100 | #151 | Good 16.7% |
| Belgians | 77.2 /100 | #152 | Good 16.7% |
| Dutch | 77.1 /100 | #153 | Good 16.7% |
| Immigrants | Venezuela | 76.0 /100 | #154 | Good 16.7% |
| South Americans | 75.1 /100 | #155 | Good 16.7% |
| Afghans | 74.4 /100 | #156 | Good 16.8% |