Immigrants from Belarus vs Immigrants from Sudan Child Poverty Among Girls Under 16
COMPARE
Immigrants from Belarus
Immigrants from Sudan
Child Poverty Among Girls Under 16
Child Poverty Among Girls Under 16 Comparison
Immigrants from Belarus
Immigrants from Sudan
14.8%
CHILD POVERTY AMONG GIRLS UNDER 16
97.0/ 100
METRIC RATING
91st/ 347
METRIC RANK
18.6%
CHILD POVERTY AMONG GIRLS UNDER 16
1.1/ 100
METRIC RATING
232nd/ 347
METRIC RANK
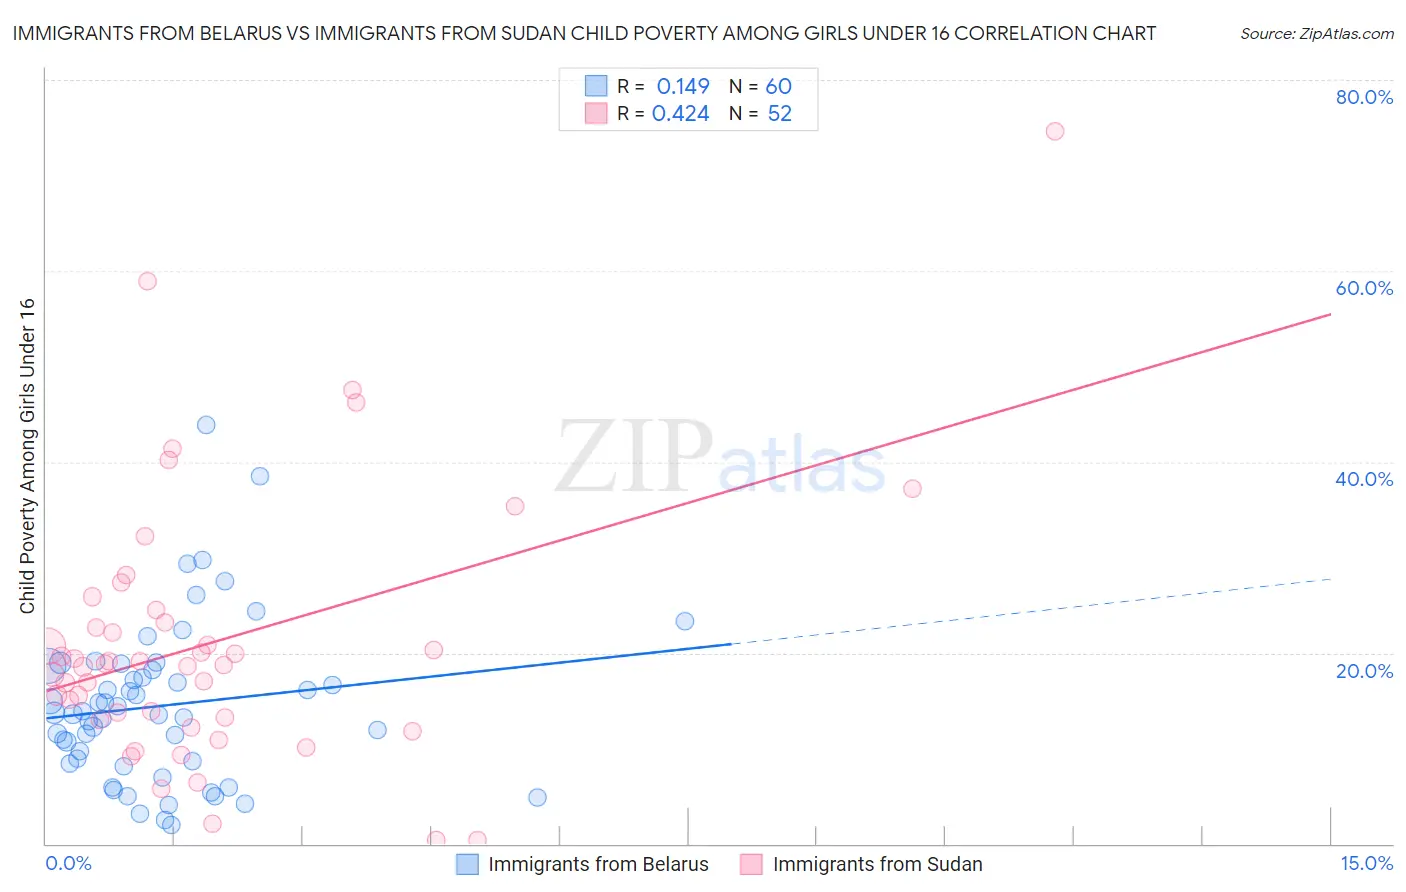
Immigrants from Belarus vs Immigrants from Sudan Child Poverty Among Girls Under 16 Correlation Chart
The statistical analysis conducted on geographies consisting of 148,734,264 people shows a poor positive correlation between the proportion of Immigrants from Belarus and poverty level among girls under the age of 16 in the United States with a correlation coefficient (R) of 0.149 and weighted average of 14.8%. Similarly, the statistical analysis conducted on geographies consisting of 118,491,324 people shows a moderate positive correlation between the proportion of Immigrants from Sudan and poverty level among girls under the age of 16 in the United States with a correlation coefficient (R) of 0.424 and weighted average of 18.6%, a difference of 25.3%.
Child Poverty Among Girls Under 16 Correlation Summary
| Measurement | Immigrants from Belarus | Immigrants from Sudan |
| Minimum | 2.0% | 0.37% |
| Maximum | 43.9% | 74.6% |
| Range | 41.9% | 74.2% |
| Mean | 14.5% | 21.1% |
| Median | 13.7% | 18.8% |
| Interquartile 25% (IQ1) | 8.5% | 13.1% |
| Interquartile 75% (IQ3) | 18.5% | 23.8% |
| Interquartile Range (IQR) | 9.9% | 10.7% |
| Standard Deviation (Sample) | 8.4% | 14.0% |
| Standard Deviation (Population) | 8.3% | 13.9% |
Similar Demographics by Child Poverty Among Girls Under 16
Demographics Similar to Immigrants from Belarus by Child Poverty Among Girls Under 16
In terms of child poverty among girls under 16, the demographic groups most similar to Immigrants from Belarus are Northern European (14.8%, a difference of 0.040%), Jordanian (14.8%, a difference of 0.060%), Immigrants from Canada (14.8%, a difference of 0.11%), Finnish (14.8%, a difference of 0.18%), and Australian (14.8%, a difference of 0.20%).
| Demographics | Rating | Rank | Child Poverty Among Girls Under 16 |
| Soviet Union | 97.3 /100 | #84 | Exceptional 14.8% |
| Swiss | 97.2 /100 | #85 | Exceptional 14.8% |
| Australians | 97.2 /100 | #86 | Exceptional 14.8% |
| Finns | 97.2 /100 | #87 | Exceptional 14.8% |
| Immigrants | Canada | 97.1 /100 | #88 | Exceptional 14.8% |
| Jordanians | 97.1 /100 | #89 | Exceptional 14.8% |
| Northern Europeans | 97.0 /100 | #90 | Exceptional 14.8% |
| Immigrants | Belarus | 97.0 /100 | #91 | Exceptional 14.8% |
| Austrians | 96.7 /100 | #92 | Exceptional 14.9% |
| Immigrants | North America | 96.6 /100 | #93 | Exceptional 14.9% |
| Immigrants | Switzerland | 96.3 /100 | #94 | Exceptional 14.9% |
| Germans | 96.3 /100 | #95 | Exceptional 14.9% |
| Immigrants | France | 96.2 /100 | #96 | Exceptional 14.9% |
| Immigrants | Latvia | 96.1 /100 | #97 | Exceptional 14.9% |
| Basques | 95.9 /100 | #98 | Exceptional 15.0% |
Demographics Similar to Immigrants from Sudan by Child Poverty Among Girls Under 16
In terms of child poverty among girls under 16, the demographic groups most similar to Immigrants from Sudan are Sudanese (18.6%, a difference of 0.040%), Fijian (18.6%, a difference of 0.11%), Nepalese (18.6%, a difference of 0.16%), Alsatian (18.6%, a difference of 0.17%), and Cree (18.5%, a difference of 0.24%).
| Demographics | Rating | Rank | Child Poverty Among Girls Under 16 |
| Immigrants | Africa | 2.7 /100 | #225 | Tragic 18.2% |
| Nicaraguans | 2.4 /100 | #226 | Tragic 18.2% |
| Immigrants | Nonimmigrants | 2.0 /100 | #227 | Tragic 18.3% |
| Alaskan Athabascans | 2.0 /100 | #228 | Tragic 18.3% |
| Ghanaians | 1.4 /100 | #229 | Tragic 18.5% |
| Osage | 1.3 /100 | #230 | Tragic 18.5% |
| Cree | 1.3 /100 | #231 | Tragic 18.5% |
| Immigrants | Sudan | 1.1 /100 | #232 | Tragic 18.6% |
| Sudanese | 1.1 /100 | #233 | Tragic 18.6% |
| Fijians | 1.1 /100 | #234 | Tragic 18.6% |
| Nepalese | 1.1 /100 | #235 | Tragic 18.6% |
| Alsatians | 1.1 /100 | #236 | Tragic 18.6% |
| Immigrants | Nigeria | 1.0 /100 | #237 | Tragic 18.6% |
| Immigrants | Eritrea | 1.0 /100 | #238 | Tragic 18.7% |
| Marshallese | 0.9 /100 | #239 | Tragic 18.7% |