Immigrants from Belize vs Immigrants from Colombia Receiving Food Stamps
COMPARE
Immigrants from Belize
Immigrants from Colombia
Receiving Food Stamps
Receiving Food Stamps Comparison
Immigrants from Belize
Immigrants from Colombia
15.2%
RECEIVING FOOD STAMPS
0.0/ 100
METRIC RATING
288th/ 347
METRIC RANK
12.9%
RECEIVING FOOD STAMPS
5.3/ 100
METRIC RATING
220th/ 347
METRIC RANK
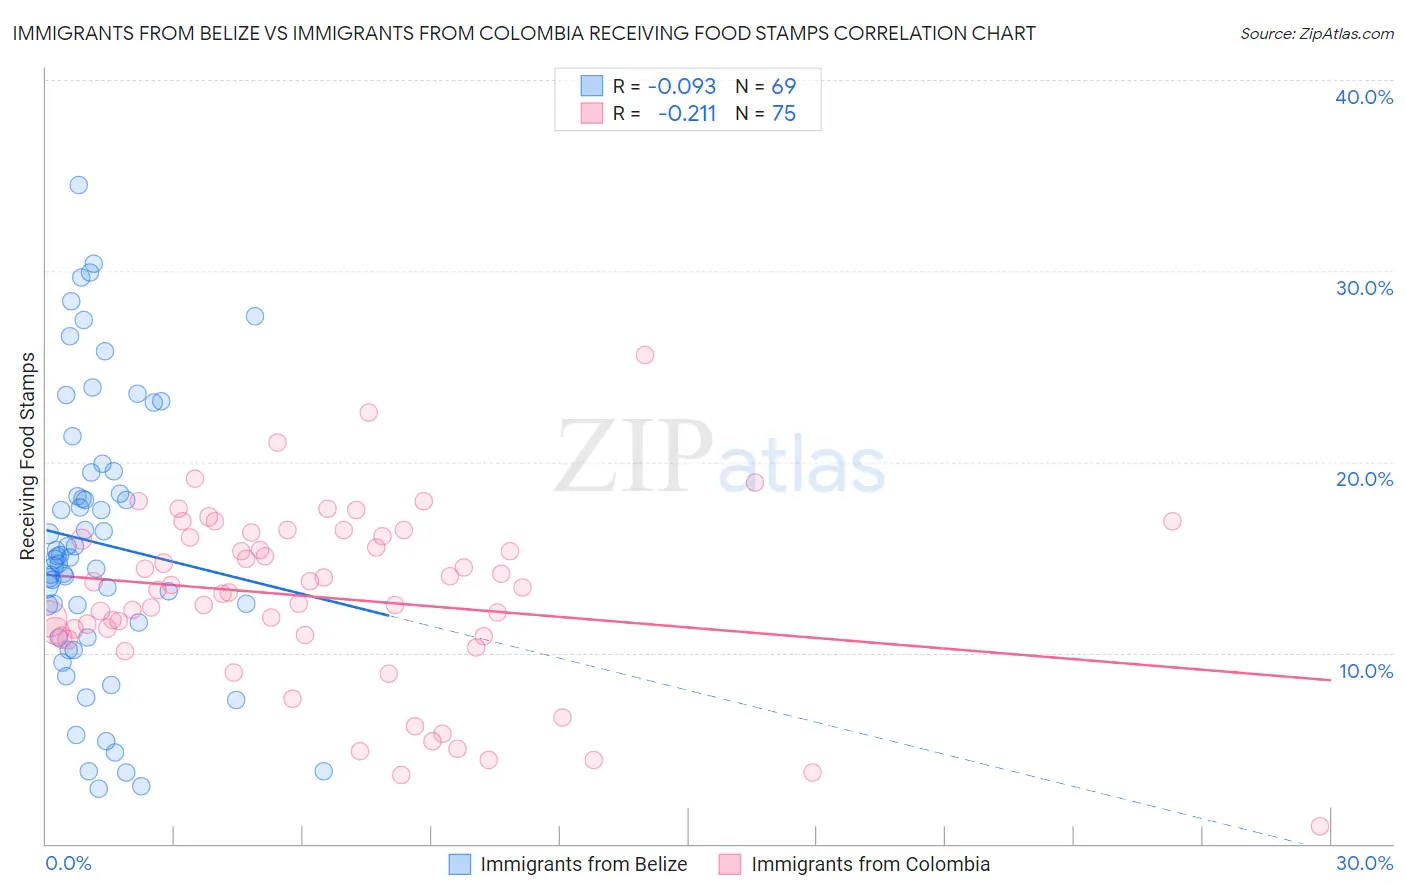
Immigrants from Belize vs Immigrants from Colombia Receiving Food Stamps Correlation Chart
The statistical analysis conducted on geographies consisting of 130,248,376 people shows a slight negative correlation between the proportion of Immigrants from Belize and percentage of population receiving government assistance and/or food stamps in the United States with a correlation coefficient (R) of -0.093 and weighted average of 15.2%. Similarly, the statistical analysis conducted on geographies consisting of 377,668,095 people shows a weak negative correlation between the proportion of Immigrants from Colombia and percentage of population receiving government assistance and/or food stamps in the United States with a correlation coefficient (R) of -0.211 and weighted average of 12.9%, a difference of 17.8%.
Receiving Food Stamps Correlation Summary
| Measurement | Immigrants from Belize | Immigrants from Colombia |
| Minimum | 2.9% | 0.90% |
| Maximum | 34.5% | 25.6% |
| Range | 31.6% | 24.7% |
| Mean | 15.8% | 12.9% |
| Median | 15.0% | 13.3% |
| Interquartile 25% (IQ1) | 11.2% | 10.8% |
| Interquartile 75% (IQ3) | 19.5% | 16.1% |
| Interquartile Range (IQR) | 8.3% | 5.3% |
| Standard Deviation (Sample) | 7.3% | 4.6% |
| Standard Deviation (Population) | 7.2% | 4.6% |
Similar Demographics by Receiving Food Stamps
Demographics Similar to Immigrants from Belize by Receiving Food Stamps
In terms of receiving food stamps, the demographic groups most similar to Immigrants from Belize are Immigrants from Mexico (15.2%, a difference of 0.46%), African (15.1%, a difference of 0.69%), Immigrants from Senegal (15.3%, a difference of 0.77%), Immigrants from Liberia (15.1%, a difference of 0.83%), and Senegalese (15.4%, a difference of 1.0%).
| Demographics | Rating | Rank | Receiving Food Stamps |
| Spanish American Indians | 0.0 /100 | #281 | Tragic 14.9% |
| Immigrants | Central America | 0.0 /100 | #282 | Tragic 15.0% |
| Bangladeshis | 0.0 /100 | #283 | Tragic 15.0% |
| Immigrants | Ecuador | 0.0 /100 | #284 | Tragic 15.0% |
| Immigrants | Liberia | 0.0 /100 | #285 | Tragic 15.1% |
| Africans | 0.0 /100 | #286 | Tragic 15.1% |
| Immigrants | Mexico | 0.0 /100 | #287 | Tragic 15.2% |
| Immigrants | Belize | 0.0 /100 | #288 | Tragic 15.2% |
| Immigrants | Senegal | 0.0 /100 | #289 | Tragic 15.3% |
| Senegalese | 0.0 /100 | #290 | Tragic 15.4% |
| Hondurans | 0.0 /100 | #291 | Tragic 15.5% |
| Alaska Natives | 0.0 /100 | #292 | Tragic 15.6% |
| Vietnamese | 0.0 /100 | #293 | Tragic 15.7% |
| Immigrants | Latin America | 0.0 /100 | #294 | Tragic 15.7% |
| Immigrants | Honduras | 0.0 /100 | #295 | Tragic 15.7% |
Demographics Similar to Immigrants from Colombia by Receiving Food Stamps
In terms of receiving food stamps, the demographic groups most similar to Immigrants from Colombia are Immigrants from Middle Africa (12.9%, a difference of 0.040%), Hawaiian (12.9%, a difference of 0.050%), Bermudan (13.0%, a difference of 0.32%), Immigrants from Burma/Myanmar (12.9%, a difference of 0.41%), and Immigrants (13.0%, a difference of 0.58%).
| Demographics | Rating | Rank | Receiving Food Stamps |
| Moroccans | 7.6 /100 | #213 | Tragic 12.8% |
| Immigrants | Africa | 7.6 /100 | #214 | Tragic 12.8% |
| Native Hawaiians | 6.7 /100 | #215 | Tragic 12.8% |
| Immigrants | South America | 6.5 /100 | #216 | Tragic 12.8% |
| Immigrants | Burma/Myanmar | 6.0 /100 | #217 | Tragic 12.9% |
| Hawaiians | 5.4 /100 | #218 | Tragic 12.9% |
| Immigrants | Middle Africa | 5.4 /100 | #219 | Tragic 12.9% |
| Immigrants | Colombia | 5.3 /100 | #220 | Tragic 12.9% |
| Bermudans | 4.8 /100 | #221 | Tragic 13.0% |
| Immigrants | Immigrants | 4.4 /100 | #222 | Tragic 13.0% |
| Immigrants | Albania | 4.4 /100 | #223 | Tragic 13.0% |
| Immigrants | Armenia | 4.3 /100 | #224 | Tragic 13.0% |
| Fijians | 4.3 /100 | #225 | Tragic 13.0% |
| Chickasaw | 3.6 /100 | #226 | Tragic 13.1% |
| Nigerians | 3.5 /100 | #227 | Tragic 13.1% |