Immigrants from Denmark vs Laotian Single Father Poverty
COMPARE
Immigrants from Denmark
Laotian
Single Father Poverty
Single Father Poverty Comparison
Immigrants from Denmark
Laotians
16.7%
SINGLE FATHER POVERTY
8.1/ 100
METRIC RATING
220th/ 347
METRIC RANK
15.1%
SINGLE FATHER POVERTY
99.9/ 100
METRIC RATING
57th/ 347
METRIC RANK
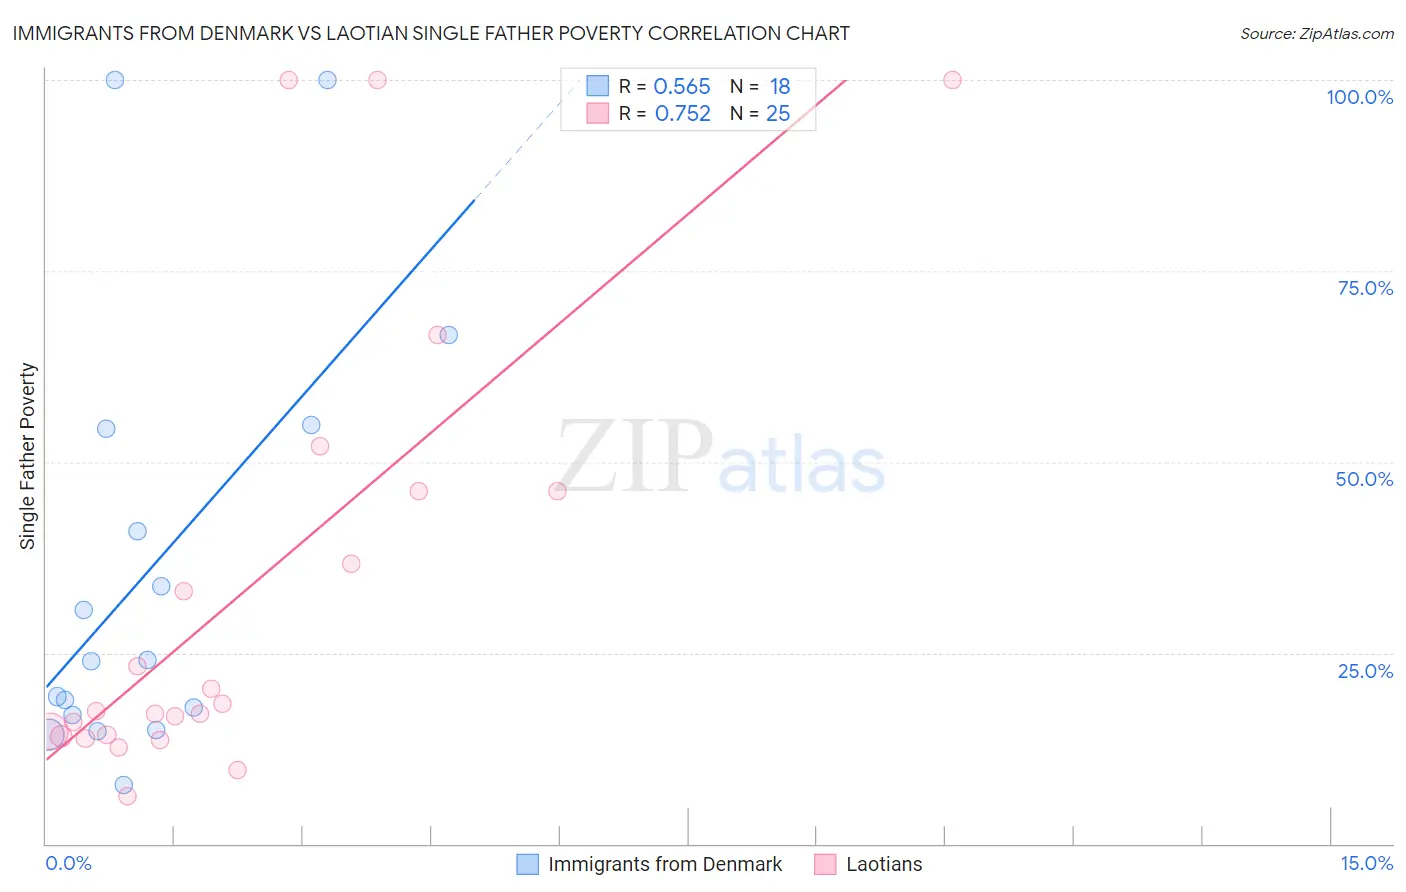
Immigrants from Denmark vs Laotian Single Father Poverty Correlation Chart
The statistical analysis conducted on geographies consisting of 116,977,797 people shows a substantial positive correlation between the proportion of Immigrants from Denmark and poverty level among single fathers in the United States with a correlation coefficient (R) of 0.565 and weighted average of 16.7%. Similarly, the statistical analysis conducted on geographies consisting of 189,346,173 people shows a strong positive correlation between the proportion of Laotians and poverty level among single fathers in the United States with a correlation coefficient (R) of 0.752 and weighted average of 15.1%, a difference of 11.0%.
Single Father Poverty Correlation Summary
| Measurement | Immigrants from Denmark | Laotian |
| Minimum | 7.7% | 6.3% |
| Maximum | 100.0% | 100.0% |
| Range | 92.3% | 93.7% |
| Mean | 36.3% | 33.0% |
| Median | 24.0% | 17.4% |
| Interquartile 25% (IQ1) | 16.9% | 14.1% |
| Interquartile 75% (IQ3) | 54.3% | 46.1% |
| Interquartile Range (IQR) | 37.4% | 32.0% |
| Standard Deviation (Sample) | 28.3% | 29.3% |
| Standard Deviation (Population) | 27.5% | 28.7% |
Similar Demographics by Single Father Poverty
Demographics Similar to Immigrants from Denmark by Single Father Poverty
In terms of single father poverty, the demographic groups most similar to Immigrants from Denmark are Immigrants from Greece (16.7%, a difference of 0.0%), Immigrants from Ghana (16.7%, a difference of 0.010%), Immigrants from Spain (16.7%, a difference of 0.010%), Immigrants from Uganda (16.7%, a difference of 0.070%), and Cheyenne (16.7%, a difference of 0.17%).
| Demographics | Rating | Rank | Single Father Poverty |
| Ghanaians | 11.0 /100 | #213 | Poor 16.7% |
| Spanish | 10.7 /100 | #214 | Poor 16.7% |
| Immigrants | Scotland | 9.6 /100 | #215 | Tragic 16.7% |
| Immigrants | England | 9.5 /100 | #216 | Tragic 16.7% |
| Cheyenne | 9.3 /100 | #217 | Tragic 16.7% |
| Immigrants | Uganda | 8.6 /100 | #218 | Tragic 16.7% |
| Immigrants | Ghana | 8.1 /100 | #219 | Tragic 16.7% |
| Immigrants | Denmark | 8.1 /100 | #220 | Tragic 16.7% |
| Immigrants | Greece | 8.1 /100 | #221 | Tragic 16.7% |
| Immigrants | Spain | 8.0 /100 | #222 | Tragic 16.7% |
| Immigrants | Austria | 7.0 /100 | #223 | Tragic 16.8% |
| Immigrants | Norway | 6.5 /100 | #224 | Tragic 16.8% |
| Menominee | 6.4 /100 | #225 | Tragic 16.8% |
| Hispanics or Latinos | 6.1 /100 | #226 | Tragic 16.8% |
| British | 5.6 /100 | #227 | Tragic 16.8% |
Demographics Similar to Laotians by Single Father Poverty
In terms of single father poverty, the demographic groups most similar to Laotians are Hawaiian (15.1%, a difference of 0.060%), Immigrants from Laos (15.1%, a difference of 0.090%), Guamanian/Chamorro (15.1%, a difference of 0.15%), Immigrants from Bulgaria (15.0%, a difference of 0.36%), and Immigrants from Uzbekistan (15.0%, a difference of 0.41%).
| Demographics | Rating | Rank | Single Father Poverty |
| Bhutanese | 99.9 /100 | #50 | Exceptional 15.0% |
| Immigrants | Pakistan | 99.9 /100 | #51 | Exceptional 15.0% |
| Immigrants | El Salvador | 99.9 /100 | #52 | Exceptional 15.0% |
| Immigrants | Kenya | 99.9 /100 | #53 | Exceptional 15.0% |
| Immigrants | Uzbekistan | 99.9 /100 | #54 | Exceptional 15.0% |
| Immigrants | Bulgaria | 99.9 /100 | #55 | Exceptional 15.0% |
| Immigrants | Laos | 99.9 /100 | #56 | Exceptional 15.1% |
| Laotians | 99.9 /100 | #57 | Exceptional 15.1% |
| Hawaiians | 99.9 /100 | #58 | Exceptional 15.1% |
| Guamanians/Chamorros | 99.9 /100 | #59 | Exceptional 15.1% |
| Puget Sound Salish | 99.8 /100 | #60 | Exceptional 15.2% |
| Immigrants | Bosnia and Herzegovina | 99.8 /100 | #61 | Exceptional 15.2% |
| Immigrants | Armenia | 99.8 /100 | #62 | Exceptional 15.2% |
| Immigrants | Sweden | 99.8 /100 | #63 | Exceptional 15.2% |
| Bangladeshis | 99.8 /100 | #64 | Exceptional 15.2% |