Immigrants from Dominica vs Bolivian Male Poverty
COMPARE
Immigrants from Dominica
Bolivian
Male Poverty
Male Poverty Comparison
Immigrants from Dominica
Bolivians
14.7%
MALE POVERTY
0.0/ 100
METRIC RATING
317th/ 347
METRIC RANK
9.4%
MALE POVERTY
99.9/ 100
METRIC RATING
11th/ 347
METRIC RANK
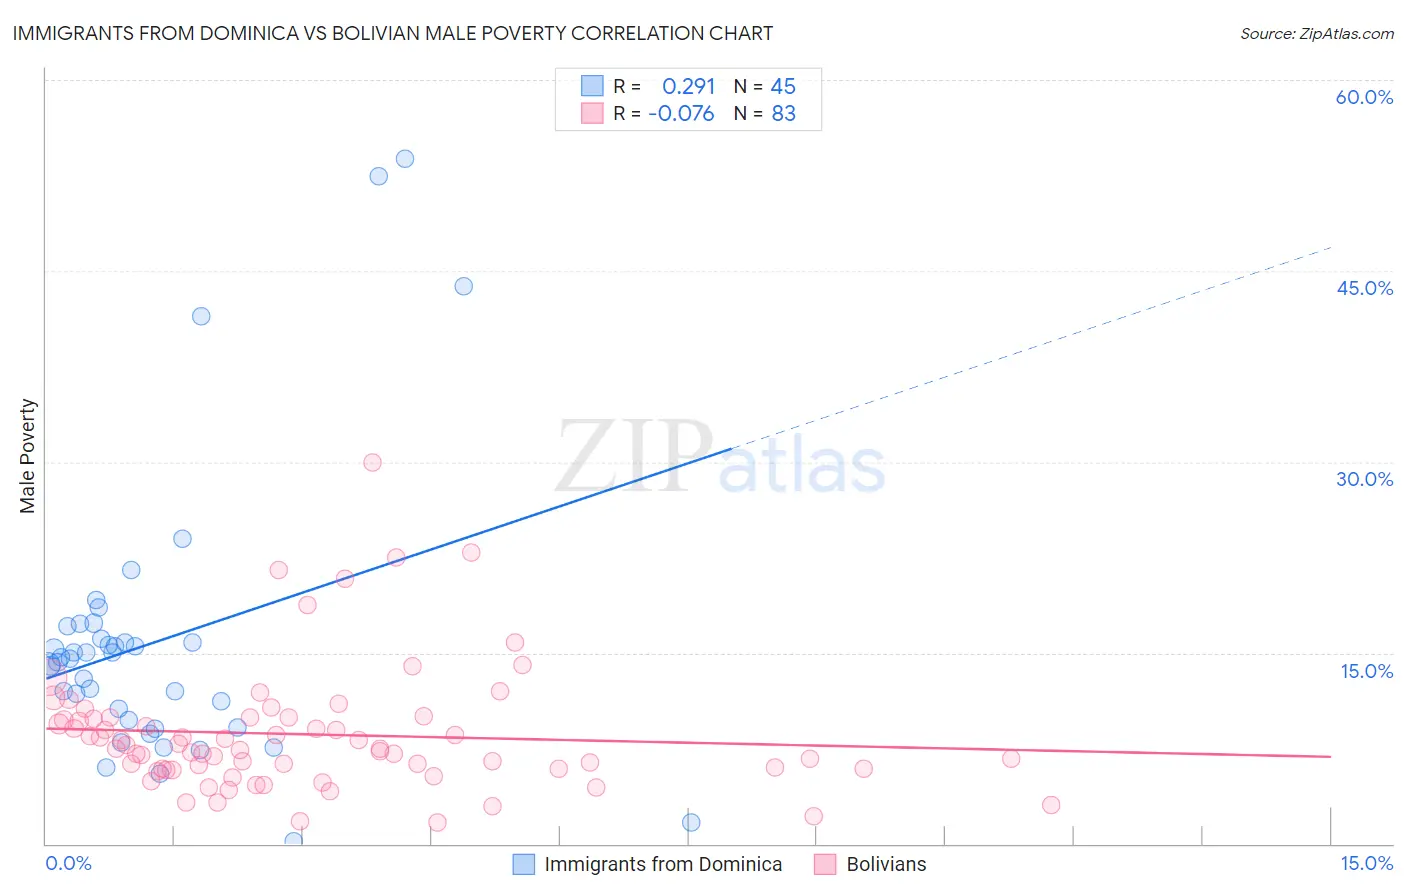
Immigrants from Dominica vs Bolivian Male Poverty Correlation Chart
The statistical analysis conducted on geographies consisting of 83,775,975 people shows a weak positive correlation between the proportion of Immigrants from Dominica and poverty level among males in the United States with a correlation coefficient (R) of 0.291 and weighted average of 14.7%. Similarly, the statistical analysis conducted on geographies consisting of 184,589,682 people shows a slight negative correlation between the proportion of Bolivians and poverty level among males in the United States with a correlation coefficient (R) of -0.076 and weighted average of 9.4%, a difference of 56.6%.
Male Poverty Correlation Summary
| Measurement | Immigrants from Dominica | Bolivian |
| Minimum | 0.21% | 1.7% |
| Maximum | 53.8% | 29.9% |
| Range | 53.6% | 28.3% |
| Mean | 15.9% | 8.6% |
| Median | 14.5% | 7.5% |
| Interquartile 25% (IQ1) | 9.4% | 5.9% |
| Interquartile 75% (IQ3) | 16.6% | 9.9% |
| Interquartile Range (IQR) | 7.2% | 4.0% |
| Standard Deviation (Sample) | 11.3% | 4.9% |
| Standard Deviation (Population) | 11.1% | 4.9% |
Similar Demographics by Male Poverty
Demographics Similar to Immigrants from Dominica by Male Poverty
In terms of male poverty, the demographic groups most similar to Immigrants from Dominica are Immigrants from Grenada (14.7%, a difference of 0.060%), U.S. Virgin Islander (14.7%, a difference of 0.090%), Immigrants from Congo (14.7%, a difference of 0.18%), British West Indian (14.6%, a difference of 0.68%), and Chippewa (14.6%, a difference of 0.70%).
| Demographics | Rating | Rank | Male Poverty |
| Seminole | 0.0 /100 | #310 | Tragic 14.3% |
| Hondurans | 0.0 /100 | #311 | Tragic 14.3% |
| Choctaw | 0.0 /100 | #312 | Tragic 14.4% |
| Immigrants | Somalia | 0.0 /100 | #313 | Tragic 14.6% |
| Immigrants | Honduras | 0.0 /100 | #314 | Tragic 14.6% |
| Chippewa | 0.0 /100 | #315 | Tragic 14.6% |
| British West Indians | 0.0 /100 | #316 | Tragic 14.6% |
| Immigrants | Dominica | 0.0 /100 | #317 | Tragic 14.7% |
| Immigrants | Grenada | 0.0 /100 | #318 | Tragic 14.7% |
| U.S. Virgin Islanders | 0.0 /100 | #319 | Tragic 14.7% |
| Immigrants | Congo | 0.0 /100 | #320 | Tragic 14.7% |
| Arapaho | 0.0 /100 | #321 | Tragic 15.1% |
| Kiowa | 0.0 /100 | #322 | Tragic 15.2% |
| Colville | 0.0 /100 | #323 | Tragic 15.2% |
| Menominee | 0.0 /100 | #324 | Tragic 15.3% |
Demographics Similar to Bolivians by Male Poverty
In terms of male poverty, the demographic groups most similar to Bolivians are Immigrants from Bolivia (9.4%, a difference of 0.050%), Immigrants from Lithuania (9.4%, a difference of 0.17%), Immigrants from North Macedonia (9.4%, a difference of 0.56%), Bulgarian (9.3%, a difference of 0.64%), and Bhutanese (9.5%, a difference of 0.85%).
| Demographics | Rating | Rank | Male Poverty |
| Immigrants | Taiwan | 100.0 /100 | #4 | Exceptional 8.9% |
| Maltese | 100.0 /100 | #5 | Exceptional 9.1% |
| Assyrians/Chaldeans/Syriacs | 99.9 /100 | #6 | Exceptional 9.1% |
| Immigrants | Ireland | 99.9 /100 | #7 | Exceptional 9.1% |
| Filipinos | 99.9 /100 | #8 | Exceptional 9.2% |
| Immigrants | South Central Asia | 99.9 /100 | #9 | Exceptional 9.3% |
| Bulgarians | 99.9 /100 | #10 | Exceptional 9.3% |
| Bolivians | 99.9 /100 | #11 | Exceptional 9.4% |
| Immigrants | Bolivia | 99.9 /100 | #12 | Exceptional 9.4% |
| Immigrants | Lithuania | 99.9 /100 | #13 | Exceptional 9.4% |
| Immigrants | North Macedonia | 99.8 /100 | #14 | Exceptional 9.4% |
| Bhutanese | 99.8 /100 | #15 | Exceptional 9.5% |
| Luxembourgers | 99.8 /100 | #16 | Exceptional 9.5% |
| Norwegians | 99.8 /100 | #17 | Exceptional 9.5% |
| Lithuanians | 99.8 /100 | #18 | Exceptional 9.5% |