Immigrants from Dominican Republic vs Sri Lankan Child Poverty Among Girls Under 16
COMPARE
Immigrants from Dominican Republic
Sri Lankan
Child Poverty Among Girls Under 16
Child Poverty Among Girls Under 16 Comparison
Immigrants from Dominican Republic
Sri Lankans
23.8%
CHILD POVERTY AMONG GIRLS UNDER 16
0.0/ 100
METRIC RATING
330th/ 347
METRIC RANK
15.2%
CHILD POVERTY AMONG GIRLS UNDER 16
94.0/ 100
METRIC RATING
114th/ 347
METRIC RANK
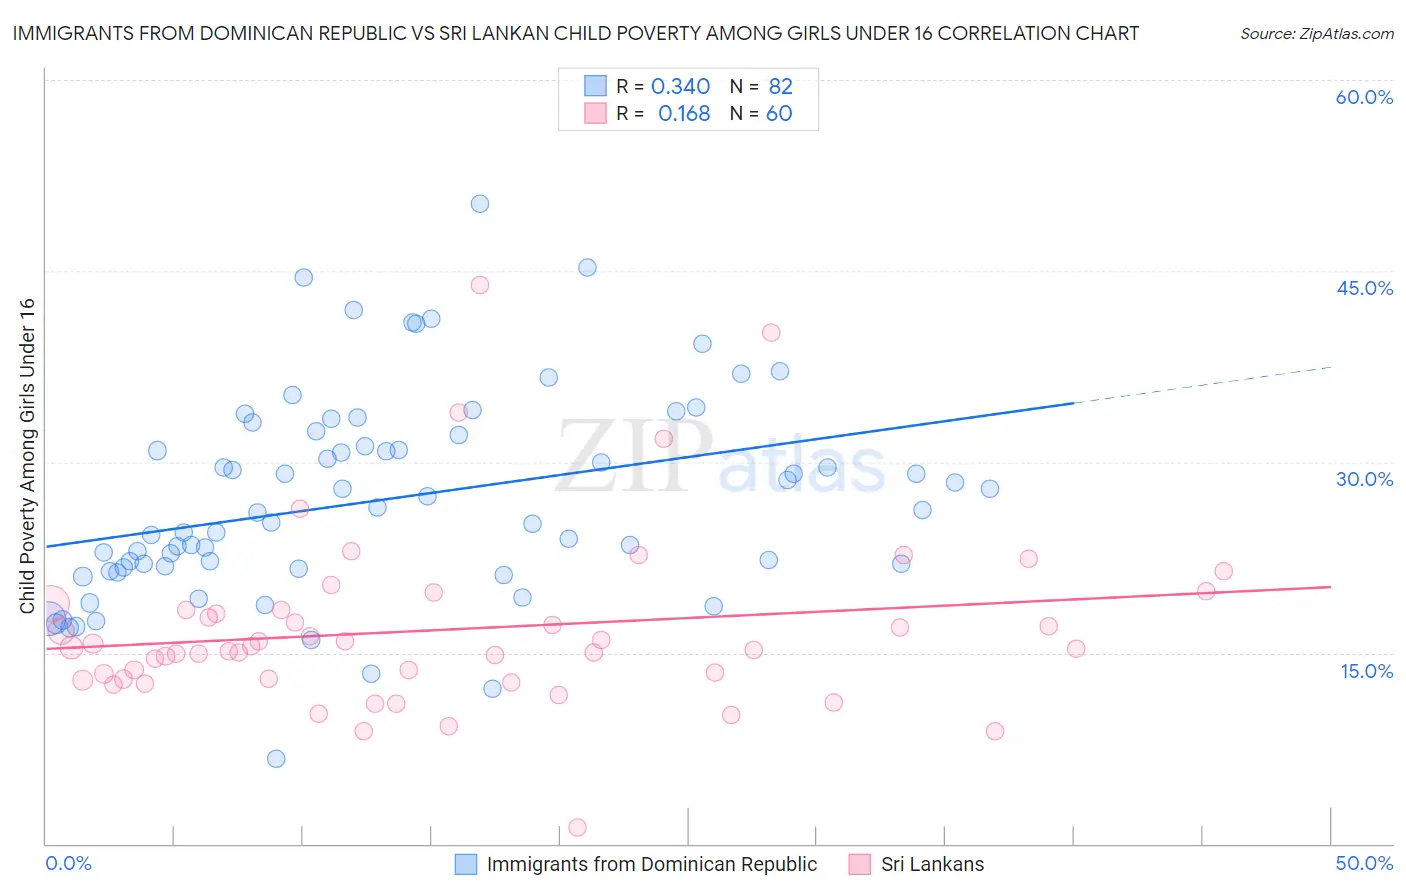
Immigrants from Dominican Republic vs Sri Lankan Child Poverty Among Girls Under 16 Correlation Chart
The statistical analysis conducted on geographies consisting of 271,039,828 people shows a mild positive correlation between the proportion of Immigrants from Dominican Republic and poverty level among girls under the age of 16 in the United States with a correlation coefficient (R) of 0.340 and weighted average of 23.8%. Similarly, the statistical analysis conducted on geographies consisting of 432,135,013 people shows a poor positive correlation between the proportion of Sri Lankans and poverty level among girls under the age of 16 in the United States with a correlation coefficient (R) of 0.168 and weighted average of 15.2%, a difference of 57.1%.
Child Poverty Among Girls Under 16 Correlation Summary
| Measurement | Immigrants from Dominican Republic | Sri Lankan |
| Minimum | 6.6% | 1.3% |
| Maximum | 50.3% | 43.9% |
| Range | 43.6% | 42.6% |
| Mean | 27.0% | 16.8% |
| Median | 26.1% | 15.3% |
| Interquartile 25% (IQ1) | 21.7% | 12.9% |
| Interquartile 75% (IQ3) | 32.1% | 18.4% |
| Interquartile Range (IQR) | 10.4% | 5.4% |
| Standard Deviation (Sample) | 8.1% | 7.0% |
| Standard Deviation (Population) | 8.1% | 7.0% |
Similar Demographics by Child Poverty Among Girls Under 16
Demographics Similar to Immigrants from Dominican Republic by Child Poverty Among Girls Under 16
In terms of child poverty among girls under 16, the demographic groups most similar to Immigrants from Dominican Republic are Apache (23.8%, a difference of 0.050%), Kiowa (23.7%, a difference of 0.54%), Dominican (23.7%, a difference of 0.65%), Native/Alaskan (24.0%, a difference of 0.91%), and Black/African American (24.7%, a difference of 3.5%).
| Demographics | Rating | Rank | Child Poverty Among Girls Under 16 |
| Cajuns | 0.0 /100 | #323 | Tragic 22.6% |
| Paiute | 0.0 /100 | #324 | Tragic 22.6% |
| Immigrants | Congo | 0.0 /100 | #325 | Tragic 22.7% |
| Immigrants | Honduras | 0.0 /100 | #326 | Tragic 22.8% |
| Central American Indians | 0.0 /100 | #327 | Tragic 22.8% |
| Dominicans | 0.0 /100 | #328 | Tragic 23.7% |
| Kiowa | 0.0 /100 | #329 | Tragic 23.7% |
| Immigrants | Dominican Republic | 0.0 /100 | #330 | Tragic 23.8% |
| Apache | 0.0 /100 | #331 | Tragic 23.8% |
| Natives/Alaskans | 0.0 /100 | #332 | Tragic 24.0% |
| Blacks/African Americans | 0.0 /100 | #333 | Tragic 24.7% |
| Menominee | 0.0 /100 | #334 | Tragic 25.0% |
| Pueblo | 0.0 /100 | #335 | Tragic 25.2% |
| Sioux | 0.0 /100 | #336 | Tragic 25.6% |
| Yup'ik | 0.0 /100 | #337 | Tragic 25.8% |
Demographics Similar to Sri Lankans by Child Poverty Among Girls Under 16
In terms of child poverty among girls under 16, the demographic groups most similar to Sri Lankans are Belgian (15.2%, a difference of 0.060%), Dutch (15.1%, a difference of 0.13%), Immigrants from Kazakhstan (15.1%, a difference of 0.15%), Palestinian (15.1%, a difference of 0.29%), and Immigrants from Croatia (15.1%, a difference of 0.34%).
| Demographics | Rating | Rank | Child Poverty Among Girls Under 16 |
| Immigrants | Ukraine | 95.0 /100 | #107 | Exceptional 15.1% |
| Immigrants | Brazil | 94.9 /100 | #108 | Exceptional 15.1% |
| Serbians | 94.8 /100 | #109 | Exceptional 15.1% |
| Immigrants | Croatia | 94.6 /100 | #110 | Exceptional 15.1% |
| Palestinians | 94.5 /100 | #111 | Exceptional 15.1% |
| Immigrants | Kazakhstan | 94.3 /100 | #112 | Exceptional 15.1% |
| Dutch | 94.3 /100 | #113 | Exceptional 15.1% |
| Sri Lankans | 94.0 /100 | #114 | Exceptional 15.2% |
| Belgians | 93.9 /100 | #115 | Exceptional 15.2% |
| Immigrants | Denmark | 93.3 /100 | #116 | Exceptional 15.2% |
| Immigrants | North Macedonia | 93.1 /100 | #117 | Exceptional 15.2% |
| Immigrants | Southern Europe | 92.7 /100 | #118 | Exceptional 15.3% |
| Immigrants | Zimbabwe | 92.5 /100 | #119 | Exceptional 15.3% |
| Pakistanis | 92.3 /100 | #120 | Exceptional 15.3% |
| English | 92.2 /100 | #121 | Exceptional 15.3% |