Immigrants from England vs Moroccan Male Poverty
COMPARE
Immigrants from England
Moroccan
Male Poverty
Male Poverty Comparison
Immigrants from England
Moroccans
10.4%
MALE POVERTY
95.5/ 100
METRIC RATING
85th/ 347
METRIC RANK
12.0%
MALE POVERTY
4.2/ 100
METRIC RATING
210th/ 347
METRIC RANK
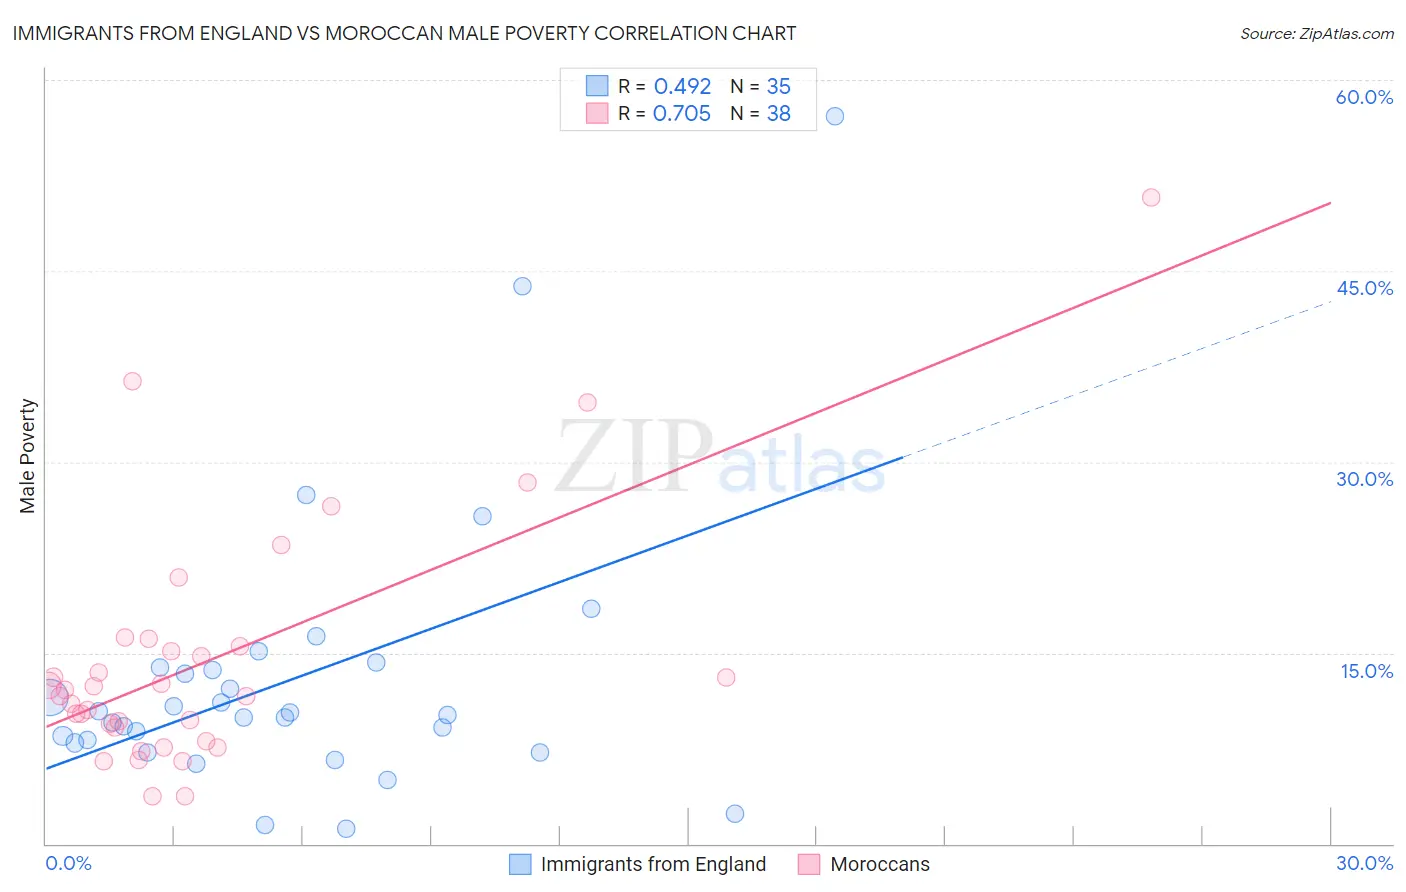
Immigrants from England vs Moroccan Male Poverty Correlation Chart
The statistical analysis conducted on geographies consisting of 391,609,977 people shows a moderate positive correlation between the proportion of Immigrants from England and poverty level among males in the United States with a correlation coefficient (R) of 0.492 and weighted average of 10.4%. Similarly, the statistical analysis conducted on geographies consisting of 201,723,684 people shows a strong positive correlation between the proportion of Moroccans and poverty level among males in the United States with a correlation coefficient (R) of 0.705 and weighted average of 12.0%, a difference of 16.4%.
Male Poverty Correlation Summary
| Measurement | Immigrants from England | Moroccan |
| Minimum | 1.2% | 3.7% |
| Maximum | 57.1% | 50.7% |
| Range | 55.9% | 47.0% |
| Mean | 13.0% | 14.4% |
| Median | 10.2% | 11.8% |
| Interquartile 25% (IQ1) | 7.9% | 9.1% |
| Interquartile 75% (IQ3) | 13.9% | 15.5% |
| Interquartile Range (IQR) | 5.9% | 6.4% |
| Standard Deviation (Sample) | 11.0% | 9.7% |
| Standard Deviation (Population) | 10.8% | 9.6% |
Similar Demographics by Male Poverty
Demographics Similar to Immigrants from England by Male Poverty
In terms of male poverty, the demographic groups most similar to Immigrants from England are Czechoslovakian (10.3%, a difference of 0.050%), Immigrants from Sweden (10.3%, a difference of 0.11%), Immigrants from Eastern Asia (10.4%, a difference of 0.13%), Northern European (10.4%, a difference of 0.17%), and Egyptian (10.3%, a difference of 0.23%).
| Demographics | Rating | Rank | Male Poverty |
| Irish | 96.8 /100 | #78 | Exceptional 10.3% |
| Immigrants | North America | 96.5 /100 | #79 | Exceptional 10.3% |
| English | 96.4 /100 | #80 | Exceptional 10.3% |
| Belgians | 95.9 /100 | #81 | Exceptional 10.3% |
| Egyptians | 95.9 /100 | #82 | Exceptional 10.3% |
| Immigrants | Sweden | 95.7 /100 | #83 | Exceptional 10.3% |
| Czechoslovakians | 95.6 /100 | #84 | Exceptional 10.3% |
| Immigrants | England | 95.5 /100 | #85 | Exceptional 10.4% |
| Immigrants | Eastern Asia | 95.3 /100 | #86 | Exceptional 10.4% |
| Northern Europeans | 95.2 /100 | #87 | Exceptional 10.4% |
| Cambodians | 95.0 /100 | #88 | Exceptional 10.4% |
| Immigrants | Denmark | 95.0 /100 | #89 | Exceptional 10.4% |
| Indians (Asian) | 94.9 /100 | #90 | Exceptional 10.4% |
| British | 94.8 /100 | #91 | Exceptional 10.4% |
| Jordanians | 94.4 /100 | #92 | Exceptional 10.4% |
Demographics Similar to Moroccans by Male Poverty
In terms of male poverty, the demographic groups most similar to Moroccans are Immigrants from the Azores (12.0%, a difference of 0.050%), Immigrants from Panama (12.1%, a difference of 0.12%), Immigrants (12.0%, a difference of 0.17%), Malaysian (12.0%, a difference of 0.50%), and Immigrants from Eastern Africa (12.0%, a difference of 0.60%).
| Demographics | Rating | Rank | Male Poverty |
| Immigrants | Western Asia | 9.8 /100 | #203 | Tragic 11.8% |
| Immigrants | Uganda | 8.5 /100 | #204 | Tragic 11.8% |
| Panamanians | 6.2 /100 | #205 | Tragic 11.9% |
| Immigrants | Eastern Africa | 5.4 /100 | #206 | Tragic 12.0% |
| Malaysians | 5.2 /100 | #207 | Tragic 12.0% |
| Immigrants | Immigrants | 4.5 /100 | #208 | Tragic 12.0% |
| Immigrants | Azores | 4.3 /100 | #209 | Tragic 12.0% |
| Moroccans | 4.2 /100 | #210 | Tragic 12.0% |
| Immigrants | Panama | 4.0 /100 | #211 | Tragic 12.1% |
| Americans | 3.2 /100 | #212 | Tragic 12.1% |
| Immigrants | Nonimmigrants | 3.1 /100 | #213 | Tragic 12.1% |
| Japanese | 2.7 /100 | #214 | Tragic 12.2% |
| Immigrants | Uzbekistan | 2.6 /100 | #215 | Tragic 12.2% |
| Immigrants | Cambodia | 2.5 /100 | #216 | Tragic 12.2% |
| Immigrants | Thailand | 2.5 /100 | #217 | Tragic 12.2% |