Immigrants from Guyana vs Immigrants from Bangladesh Poverty
COMPARE
Immigrants from Guyana
Immigrants from Bangladesh
Poverty
Poverty Comparison
Immigrants from Guyana
Immigrants from Bangladesh
14.5%
POVERTY
0.1/ 100
METRIC RATING
265th/ 347
METRIC RANK
15.3%
POVERTY
0.0/ 100
METRIC RATING
297th/ 347
METRIC RANK
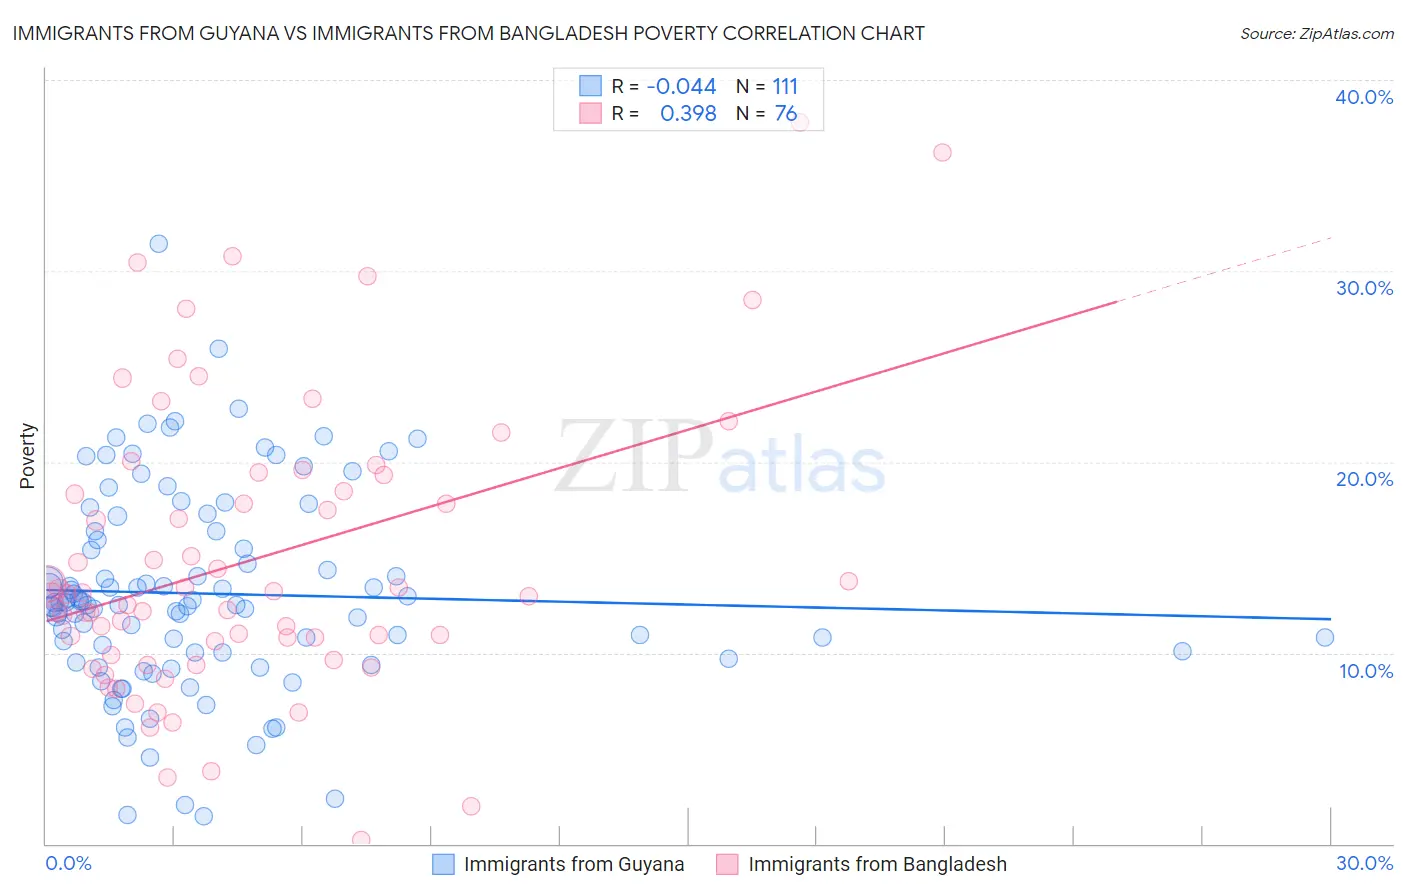
Immigrants from Guyana vs Immigrants from Bangladesh Poverty Correlation Chart
The statistical analysis conducted on geographies consisting of 183,648,527 people shows no correlation between the proportion of Immigrants from Guyana and poverty level in the United States with a correlation coefficient (R) of -0.044 and weighted average of 14.5%. Similarly, the statistical analysis conducted on geographies consisting of 203,580,134 people shows a mild positive correlation between the proportion of Immigrants from Bangladesh and poverty level in the United States with a correlation coefficient (R) of 0.398 and weighted average of 15.3%, a difference of 5.6%.
Poverty Correlation Summary
| Measurement | Immigrants from Guyana | Immigrants from Bangladesh |
| Minimum | 1.4% | 0.18% |
| Maximum | 31.4% | 37.7% |
| Range | 30.0% | 37.6% |
| Mean | 13.1% | 14.9% |
| Median | 12.6% | 13.1% |
| Interquartile 25% (IQ1) | 10.0% | 10.2% |
| Interquartile 75% (IQ3) | 16.4% | 18.9% |
| Interquartile Range (IQR) | 6.4% | 8.6% |
| Standard Deviation (Sample) | 5.3% | 7.6% |
| Standard Deviation (Population) | 5.2% | 7.5% |
Similar Demographics by Poverty
Demographics Similar to Immigrants from Guyana by Poverty
In terms of poverty, the demographic groups most similar to Immigrants from Guyana are Immigrants from Jamaica (14.4%, a difference of 0.13%), Guyanese (14.5%, a difference of 0.17%), Jamaican (14.4%, a difference of 0.21%), Iroquois (14.5%, a difference of 0.49%), and Subsaharan African (14.5%, a difference of 0.52%).
| Demographics | Rating | Rank | Poverty |
| Ottawa | 0.1 /100 | #258 | Tragic 14.3% |
| Immigrants | Nicaragua | 0.1 /100 | #259 | Tragic 14.3% |
| Cape Verdeans | 0.1 /100 | #260 | Tragic 14.4% |
| Cherokee | 0.1 /100 | #261 | Tragic 14.4% |
| Immigrants | Liberia | 0.1 /100 | #262 | Tragic 14.4% |
| Jamaicans | 0.1 /100 | #263 | Tragic 14.4% |
| Immigrants | Jamaica | 0.1 /100 | #264 | Tragic 14.4% |
| Immigrants | Guyana | 0.1 /100 | #265 | Tragic 14.5% |
| Guyanese | 0.1 /100 | #266 | Tragic 14.5% |
| Iroquois | 0.1 /100 | #267 | Tragic 14.5% |
| Sub-Saharan Africans | 0.1 /100 | #268 | Tragic 14.5% |
| Immigrants | Cuba | 0.1 /100 | #269 | Tragic 14.6% |
| Central Americans | 0.1 /100 | #270 | Tragic 14.6% |
| Shoshone | 0.0 /100 | #271 | Tragic 14.7% |
| Chickasaw | 0.0 /100 | #272 | Tragic 14.7% |
Demographics Similar to Immigrants from Bangladesh by Poverty
In terms of poverty, the demographic groups most similar to Immigrants from Bangladesh are Guatemalan (15.3%, a difference of 0.050%), Hispanic or Latino (15.3%, a difference of 0.050%), Immigrants from Senegal (15.3%, a difference of 0.15%), Senegalese (15.3%, a difference of 0.24%), and Blackfeet (15.2%, a difference of 0.47%).
| Demographics | Rating | Rank | Poverty |
| Mexicans | 0.0 /100 | #290 | Tragic 15.1% |
| Immigrants | Cabo Verde | 0.0 /100 | #291 | Tragic 15.1% |
| Indonesians | 0.0 /100 | #292 | Tragic 15.1% |
| Immigrants | Zaire | 0.0 /100 | #293 | Tragic 15.1% |
| Blackfeet | 0.0 /100 | #294 | Tragic 15.2% |
| Guatemalans | 0.0 /100 | #295 | Tragic 15.3% |
| Hispanics or Latinos | 0.0 /100 | #296 | Tragic 15.3% |
| Immigrants | Bangladesh | 0.0 /100 | #297 | Tragic 15.3% |
| Immigrants | Senegal | 0.0 /100 | #298 | Tragic 15.3% |
| Senegalese | 0.0 /100 | #299 | Tragic 15.3% |
| Immigrants | Central America | 0.0 /100 | #300 | Tragic 15.4% |
| Bahamians | 0.0 /100 | #301 | Tragic 15.4% |
| Somalis | 0.0 /100 | #302 | Tragic 15.4% |
| Immigrants | Caribbean | 0.0 /100 | #303 | Tragic 15.5% |
| Immigrants | Mexico | 0.0 /100 | #304 | Tragic 15.5% |