Immigrants from Israel vs Immigrants from Armenia Poverty
COMPARE
Immigrants from Israel
Immigrants from Armenia
Poverty
Poverty Comparison
Immigrants from Israel
Immigrants from Armenia
11.7%
POVERTY
87.4/ 100
METRIC RATING
128th/ 347
METRIC RANK
13.9%
POVERTY
0.5/ 100
METRIC RATING
236th/ 347
METRIC RANK
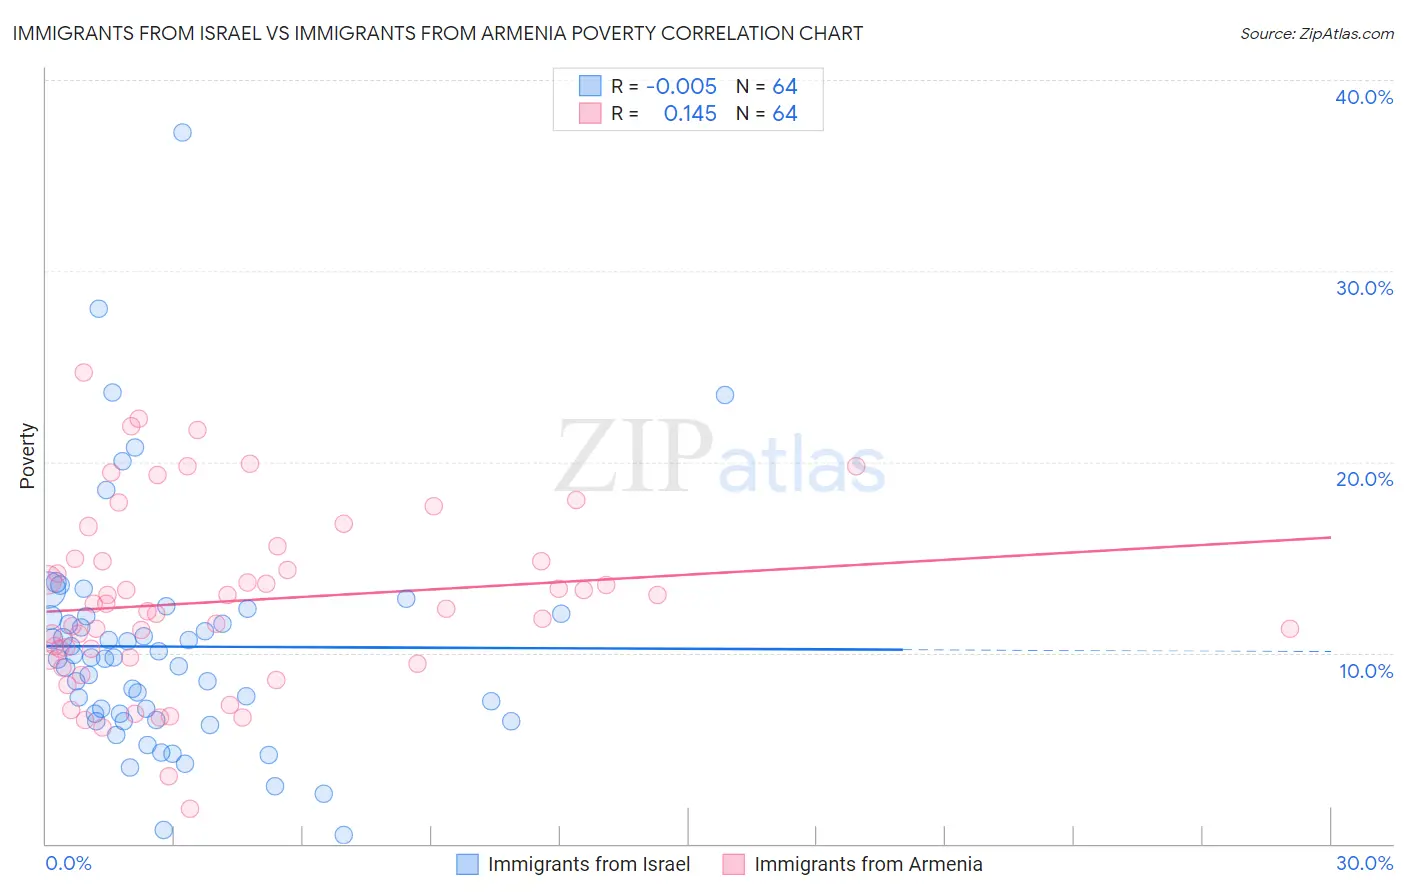
Immigrants from Israel vs Immigrants from Armenia Poverty Correlation Chart
The statistical analysis conducted on geographies consisting of 209,974,563 people shows no correlation between the proportion of Immigrants from Israel and poverty level in the United States with a correlation coefficient (R) of -0.005 and weighted average of 11.7%. Similarly, the statistical analysis conducted on geographies consisting of 97,715,591 people shows a poor positive correlation between the proportion of Immigrants from Armenia and poverty level in the United States with a correlation coefficient (R) of 0.145 and weighted average of 13.9%, a difference of 18.2%.
Poverty Correlation Summary
| Measurement | Immigrants from Israel | Immigrants from Armenia |
| Minimum | 0.47% | 1.8% |
| Maximum | 37.3% | 24.7% |
| Range | 36.8% | 22.8% |
| Mean | 10.3% | 12.7% |
| Median | 9.7% | 12.4% |
| Interquartile 25% (IQ1) | 6.6% | 9.7% |
| Interquartile 75% (IQ3) | 11.9% | 14.9% |
| Interquartile Range (IQR) | 5.2% | 5.2% |
| Standard Deviation (Sample) | 6.2% | 4.7% |
| Standard Deviation (Population) | 6.1% | 4.7% |
Similar Demographics by Poverty
Demographics Similar to Immigrants from Israel by Poverty
In terms of poverty, the demographic groups most similar to Immigrants from Israel are South African (11.7%, a difference of 0.090%), Immigrants from Argentina (11.7%, a difference of 0.13%), Immigrants from Norway (11.7%, a difference of 0.14%), Immigrants from Brazil (11.7%, a difference of 0.18%), and Immigrants from Ukraine (11.8%, a difference of 0.19%).
| Demographics | Rating | Rank | Poverty |
| New Zealanders | 88.7 /100 | #121 | Excellent 11.7% |
| Puget Sound Salish | 88.7 /100 | #122 | Excellent 11.7% |
| Immigrants | Hungary | 88.6 /100 | #123 | Excellent 11.7% |
| Soviet Union | 88.4 /100 | #124 | Excellent 11.7% |
| Immigrants | Brazil | 88.2 /100 | #125 | Excellent 11.7% |
| Immigrants | Norway | 88.0 /100 | #126 | Excellent 11.7% |
| Immigrants | Argentina | 88.0 /100 | #127 | Excellent 11.7% |
| Immigrants | Israel | 87.4 /100 | #128 | Excellent 11.7% |
| South Africans | 87.0 /100 | #129 | Excellent 11.7% |
| Immigrants | Ukraine | 86.6 /100 | #130 | Excellent 11.8% |
| French | 86.1 /100 | #131 | Excellent 11.8% |
| Peruvians | 85.6 /100 | #132 | Excellent 11.8% |
| Immigrants | Western Europe | 85.2 /100 | #133 | Excellent 11.8% |
| Yugoslavians | 85.2 /100 | #134 | Excellent 11.8% |
| Immigrants | Vietnam | 85.2 /100 | #135 | Excellent 11.8% |
Demographics Similar to Immigrants from Armenia by Poverty
In terms of poverty, the demographic groups most similar to Immigrants from Armenia are French American Indian (13.9%, a difference of 0.020%), Cuban (13.9%, a difference of 0.040%), Ghanaian (13.9%, a difference of 0.15%), Immigrants from Laos (13.8%, a difference of 0.47%), and Nicaraguan (13.9%, a difference of 0.50%).
| Demographics | Rating | Rank | Poverty |
| Osage | 1.5 /100 | #229 | Tragic 13.6% |
| Alaskan Athabascans | 1.5 /100 | #230 | Tragic 13.6% |
| Nigerians | 1.4 /100 | #231 | Tragic 13.6% |
| Fijians | 0.8 /100 | #232 | Tragic 13.7% |
| Immigrants | Saudi Arabia | 0.8 /100 | #233 | Tragic 13.8% |
| Immigrants | Laos | 0.7 /100 | #234 | Tragic 13.8% |
| Cubans | 0.6 /100 | #235 | Tragic 13.9% |
| Immigrants | Armenia | 0.5 /100 | #236 | Tragic 13.9% |
| French American Indians | 0.5 /100 | #237 | Tragic 13.9% |
| Ghanaians | 0.5 /100 | #238 | Tragic 13.9% |
| Nicaraguans | 0.4 /100 | #239 | Tragic 13.9% |
| Immigrants | Middle Africa | 0.4 /100 | #240 | Tragic 14.0% |
| Salvadorans | 0.4 /100 | #241 | Tragic 14.0% |
| Ecuadorians | 0.4 /100 | #242 | Tragic 14.0% |
| Sudanese | 0.3 /100 | #243 | Tragic 14.0% |