Immigrants from Laos vs Immigrants from Philippines Family Poverty
COMPARE
Immigrants from Laos
Immigrants from Philippines
Family Poverty
Family Poverty Comparison
Immigrants from Laos
Immigrants from Philippines
10.2%
FAMILY POVERTY
1.7/ 100
METRIC RATING
237th/ 347
METRIC RANK
8.0%
FAMILY POVERTY
96.5/ 100
METRIC RATING
95th/ 347
METRIC RANK
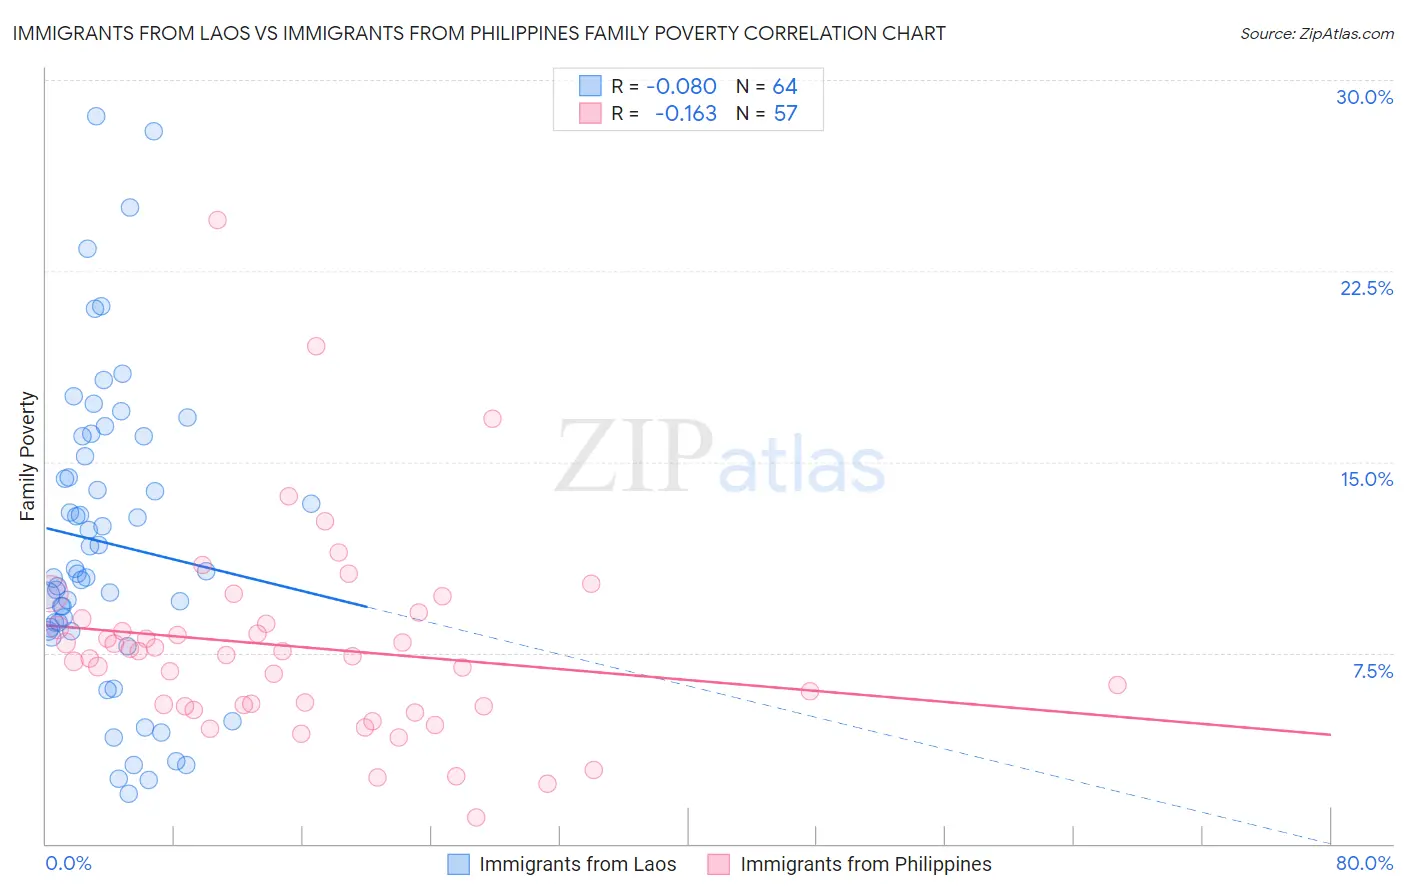
Immigrants from Laos vs Immigrants from Philippines Family Poverty Correlation Chart
The statistical analysis conducted on geographies consisting of 201,335,644 people shows a slight negative correlation between the proportion of Immigrants from Laos and poverty level among families in the United States with a correlation coefficient (R) of -0.080 and weighted average of 10.2%. Similarly, the statistical analysis conducted on geographies consisting of 469,729,486 people shows a poor negative correlation between the proportion of Immigrants from Philippines and poverty level among families in the United States with a correlation coefficient (R) of -0.163 and weighted average of 8.0%, a difference of 27.1%.
Family Poverty Correlation Summary
| Measurement | Immigrants from Laos | Immigrants from Philippines |
| Minimum | 2.0% | 1.1% |
| Maximum | 28.6% | 24.5% |
| Range | 26.6% | 23.5% |
| Mean | 11.8% | 7.7% |
| Median | 10.7% | 7.4% |
| Interquartile 25% (IQ1) | 8.4% | 5.4% |
| Interquartile 75% (IQ3) | 15.6% | 8.7% |
| Interquartile Range (IQR) | 7.2% | 3.3% |
| Standard Deviation (Sample) | 6.0% | 4.0% |
| Standard Deviation (Population) | 5.9% | 3.9% |
Similar Demographics by Family Poverty
Demographics Similar to Immigrants from Laos by Family Poverty
In terms of family poverty, the demographic groups most similar to Immigrants from Laos are Immigrants from Nigeria (10.2%, a difference of 0.26%), French American Indian (10.2%, a difference of 0.36%), Potawatomi (10.2%, a difference of 0.40%), Nigerian (10.1%, a difference of 0.51%), and Immigrants from Middle Africa (10.1%, a difference of 0.54%).
| Demographics | Rating | Rank | Family Poverty |
| Immigrants | Panama | 3.1 /100 | #230 | Tragic 10.0% |
| Alaskan Athabascans | 2.7 /100 | #231 | Tragic 10.1% |
| Immigrants | Sudan | 2.3 /100 | #232 | Tragic 10.1% |
| Fijians | 2.1 /100 | #233 | Tragic 10.1% |
| Immigrants | Middle Africa | 2.1 /100 | #234 | Tragic 10.1% |
| Nigerians | 2.0 /100 | #235 | Tragic 10.1% |
| Immigrants | Nigeria | 1.9 /100 | #236 | Tragic 10.2% |
| Immigrants | Laos | 1.7 /100 | #237 | Tragic 10.2% |
| French American Indians | 1.5 /100 | #238 | Tragic 10.2% |
| Potawatomi | 1.5 /100 | #239 | Tragic 10.2% |
| Immigrants | Azores | 1.4 /100 | #240 | Tragic 10.3% |
| Ghanaians | 1.3 /100 | #241 | Tragic 10.3% |
| Alaska Natives | 1.0 /100 | #242 | Tragic 10.4% |
| Nepalese | 0.8 /100 | #243 | Tragic 10.4% |
| Cree | 0.7 /100 | #244 | Tragic 10.5% |
Demographics Similar to Immigrants from Philippines by Family Poverty
In terms of family poverty, the demographic groups most similar to Immigrants from Philippines are Immigrants from Pakistan (8.0%, a difference of 0.010%), Immigrants from Turkey (8.0%, a difference of 0.020%), Tlingit-Haida (8.0%, a difference of 0.12%), Czechoslovakian (8.0%, a difference of 0.30%), and Immigrants from Switzerland (8.1%, a difference of 0.43%).
| Demographics | Rating | Rank | Family Poverty |
| Serbians | 97.2 /100 | #88 | Exceptional 8.0% |
| Immigrants | Denmark | 97.1 /100 | #89 | Exceptional 8.0% |
| Immigrants | England | 97.1 /100 | #90 | Exceptional 8.0% |
| Immigrants | Italy | 97.0 /100 | #91 | Exceptional 8.0% |
| Czechoslovakians | 96.8 /100 | #92 | Exceptional 8.0% |
| Tlingit-Haida | 96.7 /100 | #93 | Exceptional 8.0% |
| Immigrants | Pakistan | 96.6 /100 | #94 | Exceptional 8.0% |
| Immigrants | Philippines | 96.5 /100 | #95 | Exceptional 8.0% |
| Immigrants | Turkey | 96.5 /100 | #96 | Exceptional 8.0% |
| Immigrants | Switzerland | 96.1 /100 | #97 | Exceptional 8.1% |
| Immigrants | South Africa | 95.9 /100 | #98 | Exceptional 8.1% |
| Welsh | 95.8 /100 | #99 | Exceptional 8.1% |
| New Zealanders | 95.8 /100 | #100 | Exceptional 8.1% |
| Immigrants | Norway | 95.7 /100 | #101 | Exceptional 8.1% |
| Immigrants | Indonesia | 95.7 /100 | #102 | Exceptional 8.1% |