Immigrants from Liberia vs Comanche Family Poverty
COMPARE
Immigrants from Liberia
Comanche
Family Poverty
Family Poverty Comparison
Immigrants from Liberia
Comanche
10.8%
FAMILY POVERTY
0.2/ 100
METRIC RATING
255th/ 347
METRIC RANK
11.0%
FAMILY POVERTY
0.1/ 100
METRIC RATING
267th/ 347
METRIC RANK
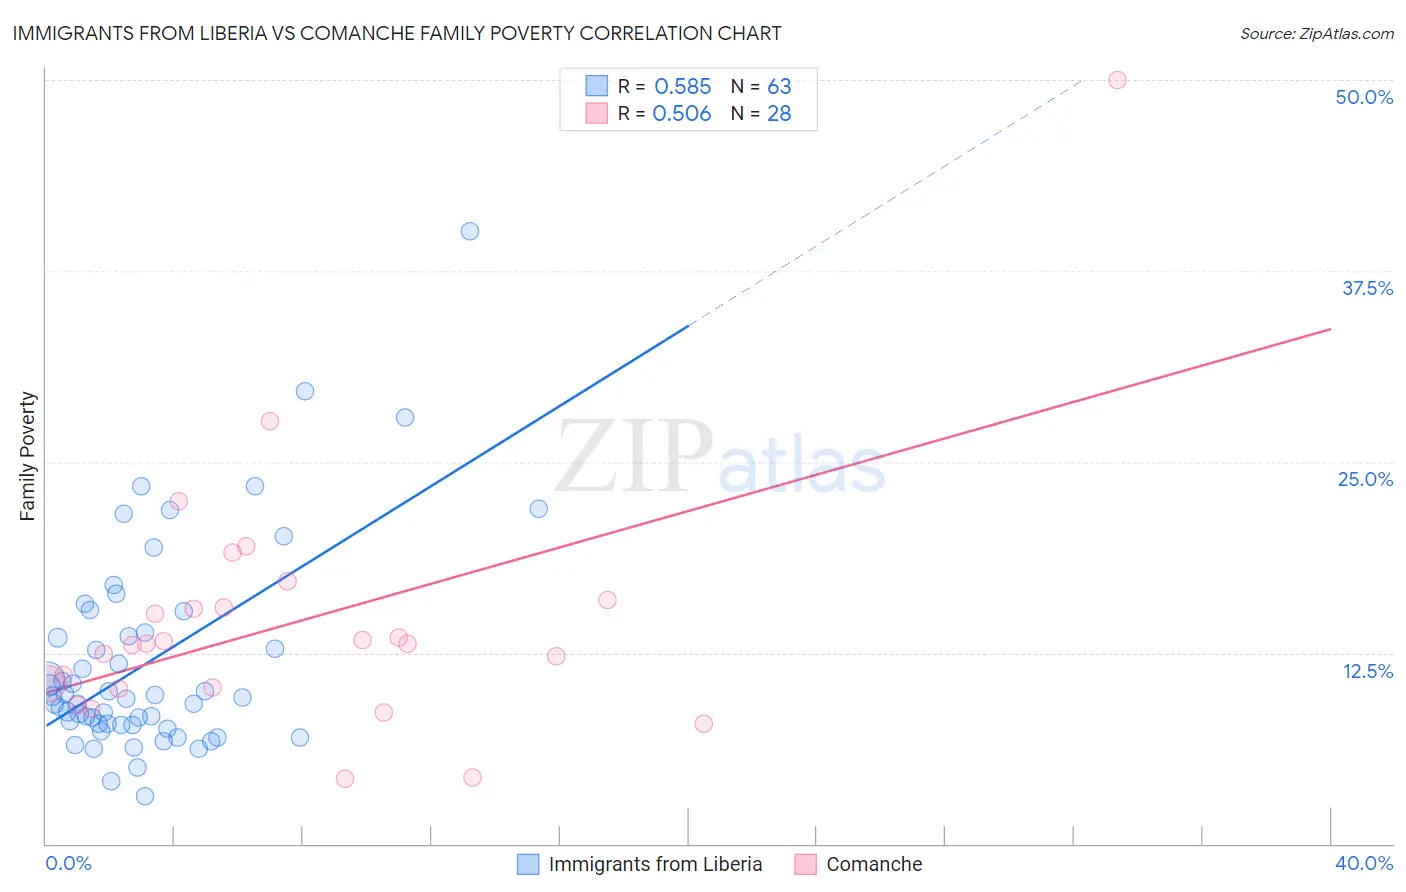
Immigrants from Liberia vs Comanche Family Poverty Correlation Chart
The statistical analysis conducted on geographies consisting of 135,184,573 people shows a substantial positive correlation between the proportion of Immigrants from Liberia and poverty level among families in the United States with a correlation coefficient (R) of 0.585 and weighted average of 10.8%. Similarly, the statistical analysis conducted on geographies consisting of 109,722,823 people shows a substantial positive correlation between the proportion of Comanche and poverty level among families in the United States with a correlation coefficient (R) of 0.506 and weighted average of 11.0%, a difference of 2.1%.
Family Poverty Correlation Summary
| Measurement | Immigrants from Liberia | Comanche |
| Minimum | 3.1% | 4.3% |
| Maximum | 40.1% | 50.0% |
| Range | 37.0% | 45.7% |
| Mean | 11.9% | 14.5% |
| Median | 9.6% | 13.1% |
| Interquartile 25% (IQ1) | 7.8% | 10.2% |
| Interquartile 75% (IQ3) | 13.8% | 15.7% |
| Interquartile Range (IQR) | 6.0% | 5.5% |
| Standard Deviation (Sample) | 6.8% | 8.6% |
| Standard Deviation (Population) | 6.7% | 8.4% |
Demographics Similar to Immigrants from Liberia and Comanche by Family Poverty
In terms of family poverty, the demographic groups most similar to Immigrants from Liberia are Chickasaw (10.8%, a difference of 0.26%), Immigrants from Ghana (10.8%, a difference of 0.30%), Subsaharan African (10.9%, a difference of 0.34%), Ecuadorian (10.8%, a difference of 0.37%), and Mexican American Indian (10.9%, a difference of 0.38%). Similarly, the demographic groups most similar to Comanche are Immigrants from El Salvador (11.0%, a difference of 0.010%), Jamaican (11.1%, a difference of 0.10%), Immigrants from Ecuador (11.1%, a difference of 0.58%), Immigrants from Nicaragua (11.1%, a difference of 0.59%), and Immigrants from Bahamas (11.1%, a difference of 0.84%).
| Demographics | Rating | Rank | Family Poverty |
| Iroquois | 0.3 /100 | #251 | Tragic 10.7% |
| Immigrants | Zaire | 0.3 /100 | #252 | Tragic 10.7% |
| Immigrants | Western Africa | 0.3 /100 | #253 | Tragic 10.7% |
| Ecuadorians | 0.2 /100 | #254 | Tragic 10.8% |
| Immigrants | Liberia | 0.2 /100 | #255 | Tragic 10.8% |
| Chickasaw | 0.2 /100 | #256 | Tragic 10.8% |
| Immigrants | Ghana | 0.2 /100 | #257 | Tragic 10.8% |
| Sub-Saharan Africans | 0.2 /100 | #258 | Tragic 10.9% |
| Mexican American Indians | 0.2 /100 | #259 | Tragic 10.9% |
| Bangladeshis | 0.2 /100 | #260 | Tragic 10.9% |
| Shoshone | 0.2 /100 | #261 | Tragic 10.9% |
| Spanish American Indians | 0.2 /100 | #262 | Tragic 10.9% |
| Cape Verdeans | 0.1 /100 | #263 | Tragic 10.9% |
| Trinidadians and Tobagonians | 0.1 /100 | #264 | Tragic 10.9% |
| Immigrants | Trinidad and Tobago | 0.1 /100 | #265 | Tragic 10.9% |
| Immigrants | El Salvador | 0.1 /100 | #266 | Tragic 11.0% |
| Comanche | 0.1 /100 | #267 | Tragic 11.0% |
| Jamaicans | 0.1 /100 | #268 | Tragic 11.1% |
| Immigrants | Ecuador | 0.1 /100 | #269 | Tragic 11.1% |
| Immigrants | Nicaragua | 0.1 /100 | #270 | Tragic 11.1% |
| Immigrants | Bahamas | 0.1 /100 | #271 | Tragic 11.1% |