Immigrants from Lithuania vs Inupiat Poverty
COMPARE
Immigrants from Lithuania
Inupiat
Poverty
Poverty Comparison
Immigrants from Lithuania
Inupiat
10.3%
POVERTY
99.9/ 100
METRIC RATING
11th/ 347
METRIC RANK
15.1%
POVERTY
0.0/ 100
METRIC RATING
287th/ 347
METRIC RANK
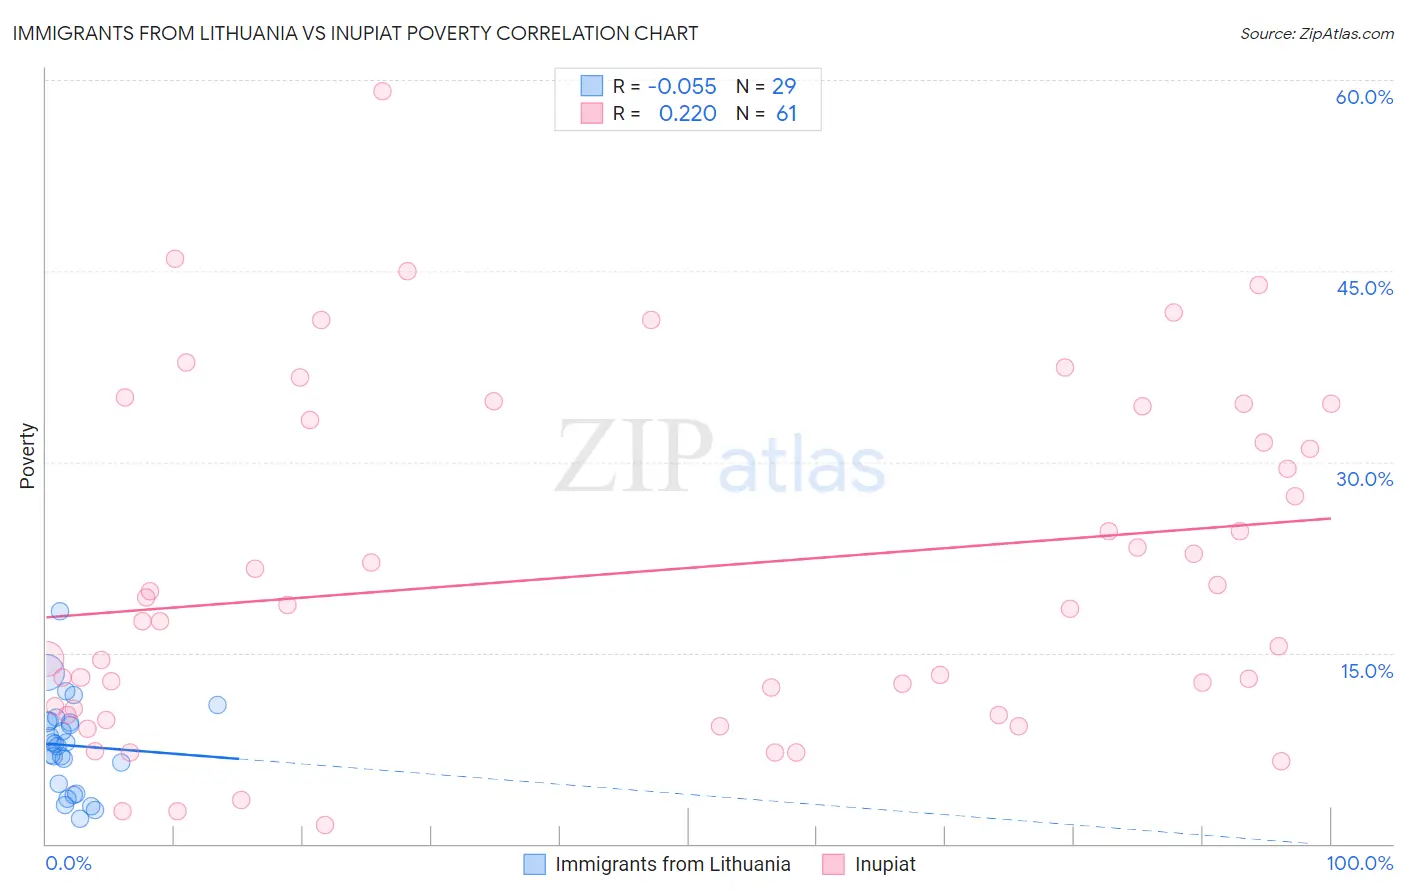
Immigrants from Lithuania vs Inupiat Poverty Correlation Chart
The statistical analysis conducted on geographies consisting of 117,712,051 people shows a slight negative correlation between the proportion of Immigrants from Lithuania and poverty level in the United States with a correlation coefficient (R) of -0.055 and weighted average of 10.3%. Similarly, the statistical analysis conducted on geographies consisting of 96,319,332 people shows a weak positive correlation between the proportion of Inupiat and poverty level in the United States with a correlation coefficient (R) of 0.220 and weighted average of 15.1%, a difference of 45.6%.
Poverty Correlation Summary
| Measurement | Immigrants from Lithuania | Inupiat |
| Minimum | 2.0% | 1.4% |
| Maximum | 18.3% | 59.1% |
| Range | 16.4% | 57.7% |
| Mean | 7.7% | 21.3% |
| Median | 7.9% | 18.4% |
| Interquartile 25% (IQ1) | 4.3% | 10.3% |
| Interquartile 75% (IQ3) | 9.6% | 33.9% |
| Interquartile Range (IQR) | 5.3% | 23.5% |
| Standard Deviation (Sample) | 3.7% | 13.3% |
| Standard Deviation (Population) | 3.6% | 13.2% |
Similar Demographics by Poverty
Demographics Similar to Immigrants from Lithuania by Poverty
In terms of poverty, the demographic groups most similar to Immigrants from Lithuania are Bhutanese (10.4%, a difference of 0.35%), Immigrants from Hong Kong (10.4%, a difference of 0.57%), Immigrants from Bolivia (10.4%, a difference of 0.89%), Bolivian (10.4%, a difference of 0.89%), and Bulgarian (10.2%, a difference of 0.99%).
| Demographics | Rating | Rank | Poverty |
| Immigrants | Taiwan | 100.0 /100 | #4 | Exceptional 9.7% |
| Immigrants | Ireland | 99.9 /100 | #5 | Exceptional 10.1% |
| Assyrians/Chaldeans/Syriacs | 99.9 /100 | #6 | Exceptional 10.1% |
| Filipinos | 99.9 /100 | #7 | Exceptional 10.1% |
| Maltese | 99.9 /100 | #8 | Exceptional 10.2% |
| Immigrants | South Central Asia | 99.9 /100 | #9 | Exceptional 10.2% |
| Bulgarians | 99.9 /100 | #10 | Exceptional 10.2% |
| Immigrants | Lithuania | 99.9 /100 | #11 | Exceptional 10.3% |
| Bhutanese | 99.8 /100 | #12 | Exceptional 10.4% |
| Immigrants | Hong Kong | 99.8 /100 | #13 | Exceptional 10.4% |
| Immigrants | Bolivia | 99.8 /100 | #14 | Exceptional 10.4% |
| Bolivians | 99.8 /100 | #15 | Exceptional 10.4% |
| Lithuanians | 99.8 /100 | #16 | Exceptional 10.5% |
| Norwegians | 99.8 /100 | #17 | Exceptional 10.5% |
| Latvians | 99.8 /100 | #18 | Exceptional 10.5% |
Demographics Similar to Inupiat by Poverty
In terms of poverty, the demographic groups most similar to Inupiat are Yaqui (15.1%, a difference of 0.010%), Immigrants from Belize (15.1%, a difference of 0.13%), Immigrants from Latin America (15.0%, a difference of 0.21%), Mexican (15.1%, a difference of 0.23%), and Immigrants from Cabo Verde (15.1%, a difference of 0.36%).
| Demographics | Rating | Rank | Poverty |
| Haitians | 0.0 /100 | #280 | Tragic 14.9% |
| Immigrants | Barbados | 0.0 /100 | #281 | Tragic 14.9% |
| Comanche | 0.0 /100 | #282 | Tragic 15.0% |
| Immigrants | Haiti | 0.0 /100 | #283 | Tragic 15.0% |
| West Indians | 0.0 /100 | #284 | Tragic 15.0% |
| Vietnamese | 0.0 /100 | #285 | Tragic 15.0% |
| Immigrants | Latin America | 0.0 /100 | #286 | Tragic 15.0% |
| Inupiat | 0.0 /100 | #287 | Tragic 15.1% |
| Yaqui | 0.0 /100 | #288 | Tragic 15.1% |
| Immigrants | Belize | 0.0 /100 | #289 | Tragic 15.1% |
| Mexicans | 0.0 /100 | #290 | Tragic 15.1% |
| Immigrants | Cabo Verde | 0.0 /100 | #291 | Tragic 15.1% |
| Indonesians | 0.0 /100 | #292 | Tragic 15.1% |
| Immigrants | Zaire | 0.0 /100 | #293 | Tragic 15.1% |
| Blackfeet | 0.0 /100 | #294 | Tragic 15.2% |