Immigrants from Mexico vs South American Child Poverty Among Boys Under 16
COMPARE
Immigrants from Mexico
South American
Child Poverty Among Boys Under 16
Child Poverty Among Boys Under 16 Comparison
Immigrants from Mexico
South Americans
21.5%
CHILD POVERTY AMONG BOYS UNDER 16
0.0/ 100
METRIC RATING
308th/ 347
METRIC RANK
16.3%
CHILD POVERTY AMONG BOYS UNDER 16
55.3/ 100
METRIC RATING
168th/ 347
METRIC RANK
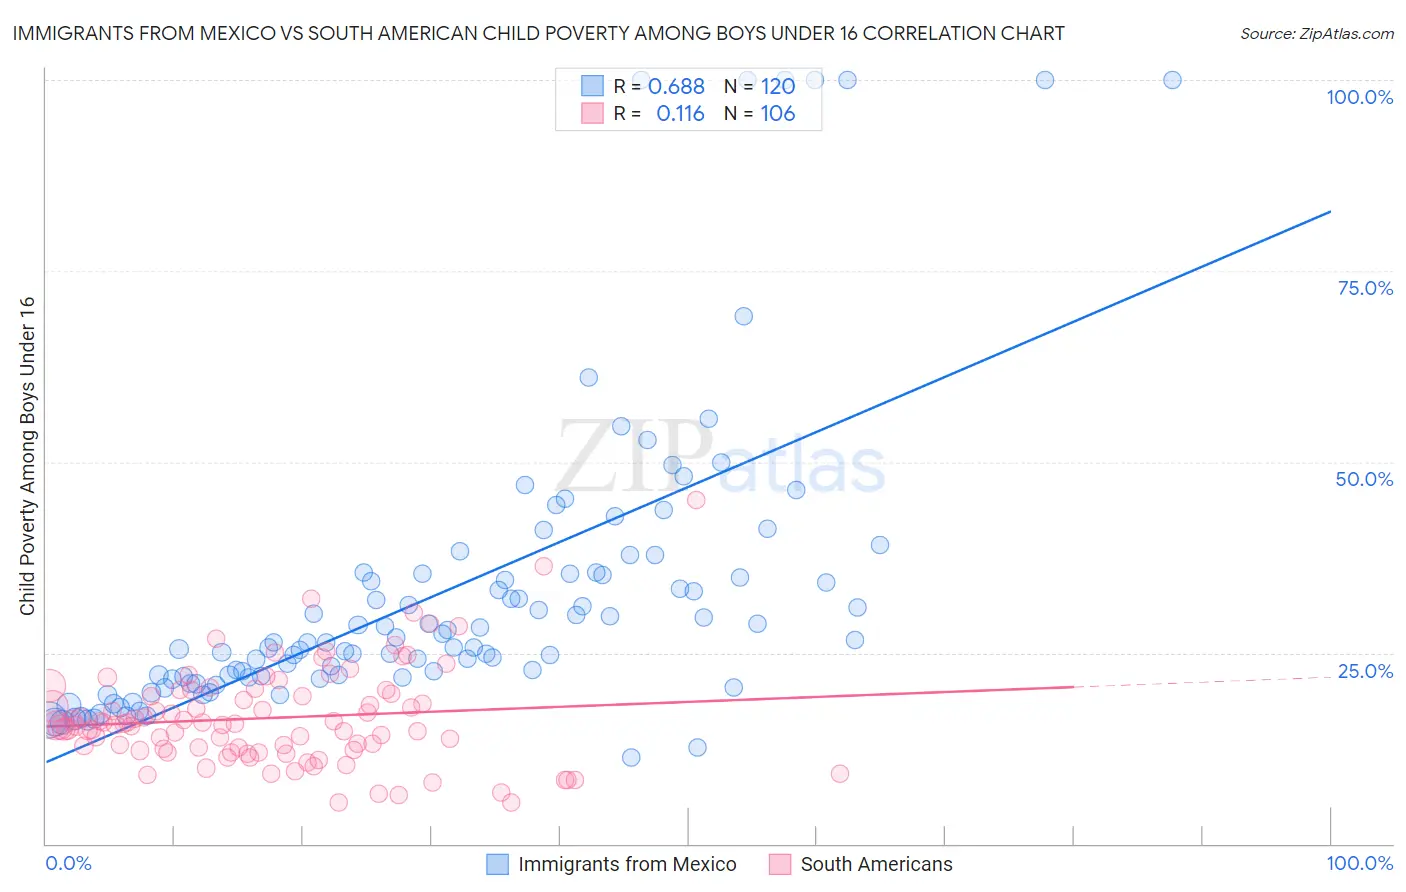
Immigrants from Mexico vs South American Child Poverty Among Boys Under 16 Correlation Chart
The statistical analysis conducted on geographies consisting of 502,962,166 people shows a significant positive correlation between the proportion of Immigrants from Mexico and poverty level among boys under the age of 16 in the United States with a correlation coefficient (R) of 0.688 and weighted average of 21.5%. Similarly, the statistical analysis conducted on geographies consisting of 482,291,014 people shows a poor positive correlation between the proportion of South Americans and poverty level among boys under the age of 16 in the United States with a correlation coefficient (R) of 0.116 and weighted average of 16.3%, a difference of 31.5%.
Child Poverty Among Boys Under 16 Correlation Summary
| Measurement | Immigrants from Mexico | South American |
| Minimum | 11.3% | 5.4% |
| Maximum | 100.0% | 45.1% |
| Range | 88.7% | 39.7% |
| Mean | 32.9% | 16.5% |
| Median | 26.3% | 15.5% |
| Interquartile 25% (IQ1) | 21.8% | 12.3% |
| Interquartile 75% (IQ3) | 35.4% | 19.7% |
| Interquartile Range (IQR) | 13.6% | 7.4% |
| Standard Deviation (Sample) | 19.8% | 6.5% |
| Standard Deviation (Population) | 19.7% | 6.5% |
Similar Demographics by Child Poverty Among Boys Under 16
Demographics Similar to Immigrants from Mexico by Child Poverty Among Boys Under 16
In terms of child poverty among boys under 16, the demographic groups most similar to Immigrants from Mexico are Seminole (21.5%, a difference of 0.18%), Creek (21.5%, a difference of 0.24%), Bahamian (21.6%, a difference of 0.35%), Immigrants from Guatemala (21.6%, a difference of 0.43%), and British West Indian (21.6%, a difference of 0.43%).
| Demographics | Rating | Rank | Child Poverty Among Boys Under 16 |
| Guatemalans | 0.0 /100 | #301 | Tragic 21.1% |
| Somalis | 0.0 /100 | #302 | Tragic 21.1% |
| Immigrants | Haiti | 0.0 /100 | #303 | Tragic 21.3% |
| Immigrants | Central America | 0.0 /100 | #304 | Tragic 21.3% |
| Kiowa | 0.0 /100 | #305 | Tragic 21.3% |
| Immigrants | Grenada | 0.0 /100 | #306 | Tragic 21.3% |
| Choctaw | 0.0 /100 | #307 | Tragic 21.3% |
| Immigrants | Mexico | 0.0 /100 | #308 | Tragic 21.5% |
| Seminole | 0.0 /100 | #309 | Tragic 21.5% |
| Creek | 0.0 /100 | #310 | Tragic 21.5% |
| Bahamians | 0.0 /100 | #311 | Tragic 21.6% |
| Immigrants | Guatemala | 0.0 /100 | #312 | Tragic 21.6% |
| British West Indians | 0.0 /100 | #313 | Tragic 21.6% |
| Ute | 0.0 /100 | #314 | Tragic 21.6% |
| Immigrants | Somalia | 0.0 /100 | #315 | Tragic 21.7% |
Demographics Similar to South Americans by Child Poverty Among Boys Under 16
In terms of child poverty among boys under 16, the demographic groups most similar to South Americans are Afghan (16.3%, a difference of 0.010%), Immigrants from Saudi Arabia (16.4%, a difference of 0.19%), Immigrants from Bosnia and Herzegovina (16.4%, a difference of 0.40%), Immigrants from Ethiopia (16.4%, a difference of 0.45%), and Immigrants from Colombia (16.4%, a difference of 0.51%).
| Demographics | Rating | Rank | Child Poverty Among Boys Under 16 |
| Immigrants | Oceania | 71.3 /100 | #161 | Good 16.0% |
| Guamanians/Chamorros | 69.6 /100 | #162 | Good 16.1% |
| Costa Ricans | 68.1 /100 | #163 | Good 16.1% |
| Immigrants | Albania | 67.9 /100 | #164 | Good 16.1% |
| Colombians | 65.2 /100 | #165 | Good 16.1% |
| Immigrants | Germany | 63.6 /100 | #166 | Good 16.2% |
| Afghans | 55.4 /100 | #167 | Average 16.3% |
| South Americans | 55.3 /100 | #168 | Average 16.3% |
| Immigrants | Saudi Arabia | 53.6 /100 | #169 | Average 16.4% |
| Immigrants | Bosnia and Herzegovina | 51.7 /100 | #170 | Average 16.4% |
| Immigrants | Ethiopia | 51.3 /100 | #171 | Average 16.4% |
| Immigrants | Colombia | 50.8 /100 | #172 | Average 16.4% |
| Tsimshian | 50.5 /100 | #173 | Average 16.4% |
| Uruguayans | 50.0 /100 | #174 | Average 16.4% |
| Immigrants | Syria | 49.0 /100 | #175 | Average 16.5% |