Immigrants from Middle Africa vs European Poverty
COMPARE
Immigrants from Middle Africa
European
Poverty
Poverty Comparison
Immigrants from Middle Africa
Europeans
14.0%
POVERTY
0.4/ 100
METRIC RATING
240th/ 347
METRIC RANK
11.3%
POVERTY
97.2/ 100
METRIC RATING
72nd/ 347
METRIC RANK
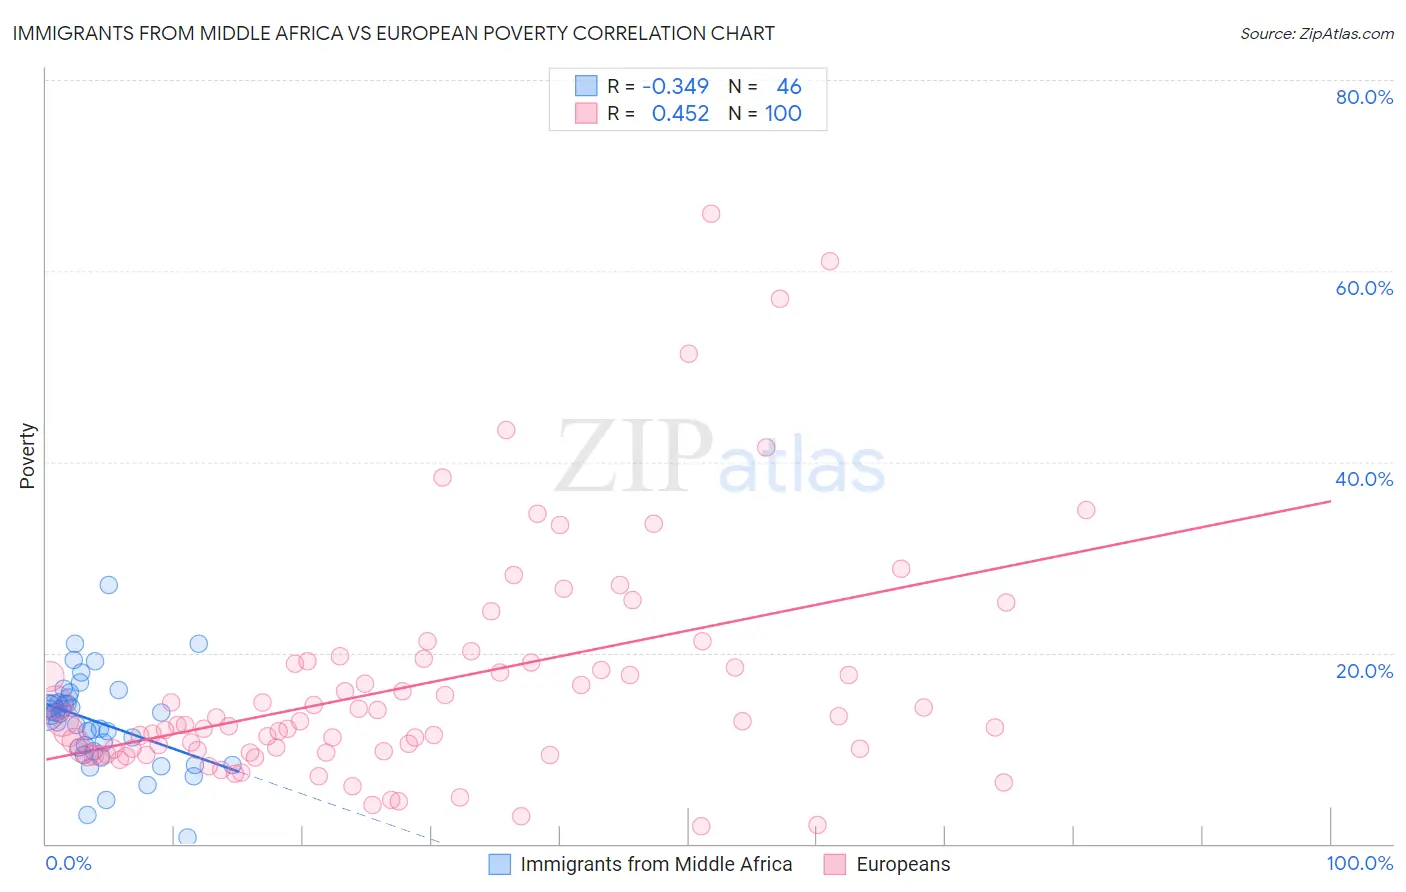
Immigrants from Middle Africa vs European Poverty Correlation Chart
The statistical analysis conducted on geographies consisting of 202,643,852 people shows a mild negative correlation between the proportion of Immigrants from Middle Africa and poverty level in the United States with a correlation coefficient (R) of -0.349 and weighted average of 14.0%. Similarly, the statistical analysis conducted on geographies consisting of 561,084,315 people shows a moderate positive correlation between the proportion of Europeans and poverty level in the United States with a correlation coefficient (R) of 0.452 and weighted average of 11.3%, a difference of 24.0%.
Poverty Correlation Summary
| Measurement | Immigrants from Middle Africa | European |
| Minimum | 0.62% | 1.9% |
| Maximum | 27.1% | 66.0% |
| Range | 26.5% | 64.1% |
| Mean | 12.8% | 16.6% |
| Median | 13.6% | 12.4% |
| Interquartile 25% (IQ1) | 9.7% | 9.6% |
| Interquartile 75% (IQ3) | 14.7% | 19.0% |
| Interquartile Range (IQR) | 5.0% | 9.3% |
| Standard Deviation (Sample) | 4.9% | 12.1% |
| Standard Deviation (Population) | 4.8% | 12.0% |
Similar Demographics by Poverty
Demographics Similar to Immigrants from Middle Africa by Poverty
In terms of poverty, the demographic groups most similar to Immigrants from Middle Africa are Salvadoran (14.0%, a difference of 0.020%), Nicaraguan (13.9%, a difference of 0.12%), Ecuadorian (14.0%, a difference of 0.34%), Sudanese (14.0%, a difference of 0.41%), and Nepalese (14.0%, a difference of 0.44%).
| Demographics | Rating | Rank | Poverty |
| Immigrants | Saudi Arabia | 0.8 /100 | #233 | Tragic 13.8% |
| Immigrants | Laos | 0.7 /100 | #234 | Tragic 13.8% |
| Cubans | 0.6 /100 | #235 | Tragic 13.9% |
| Immigrants | Armenia | 0.5 /100 | #236 | Tragic 13.9% |
| French American Indians | 0.5 /100 | #237 | Tragic 13.9% |
| Ghanaians | 0.5 /100 | #238 | Tragic 13.9% |
| Nicaraguans | 0.4 /100 | #239 | Tragic 13.9% |
| Immigrants | Middle Africa | 0.4 /100 | #240 | Tragic 14.0% |
| Salvadorans | 0.4 /100 | #241 | Tragic 14.0% |
| Ecuadorians | 0.4 /100 | #242 | Tragic 14.0% |
| Sudanese | 0.3 /100 | #243 | Tragic 14.0% |
| Nepalese | 0.3 /100 | #244 | Tragic 14.0% |
| Immigrants | Sudan | 0.3 /100 | #245 | Tragic 14.1% |
| Potawatomi | 0.3 /100 | #246 | Tragic 14.1% |
| Liberians | 0.2 /100 | #247 | Tragic 14.1% |
Demographics Similar to Europeans by Poverty
In terms of poverty, the demographic groups most similar to Europeans are Immigrants from Belgium (11.3%, a difference of 0.0%), Zimbabwean (11.3%, a difference of 0.020%), Immigrants from Canada (11.3%, a difference of 0.040%), Carpatho Rusyn (11.3%, a difference of 0.050%), and Serbian (11.2%, a difference of 0.13%).
| Demographics | Rating | Rank | Poverty |
| Immigrants | Asia | 97.5 /100 | #65 | Exceptional 11.2% |
| Immigrants | Netherlands | 97.5 /100 | #66 | Exceptional 11.2% |
| Immigrants | Australia | 97.4 /100 | #67 | Exceptional 11.2% |
| Slovaks | 97.4 /100 | #68 | Exceptional 11.2% |
| Serbians | 97.4 /100 | #69 | Exceptional 11.2% |
| Immigrants | Canada | 97.3 /100 | #70 | Exceptional 11.3% |
| Zimbabweans | 97.3 /100 | #71 | Exceptional 11.3% |
| Europeans | 97.2 /100 | #72 | Exceptional 11.3% |
| Immigrants | Belgium | 97.2 /100 | #73 | Exceptional 11.3% |
| Carpatho Rusyns | 97.2 /100 | #74 | Exceptional 11.3% |
| Immigrants | Eastern Europe | 97.0 /100 | #75 | Exceptional 11.3% |
| Immigrants | North America | 96.8 /100 | #76 | Exceptional 11.3% |
| Immigrants | Eastern Asia | 96.7 /100 | #77 | Exceptional 11.3% |
| Dutch | 96.7 /100 | #78 | Exceptional 11.3% |
| Cambodians | 96.7 /100 | #79 | Exceptional 11.3% |