Immigrants from Northern Europe vs Austrian Married-Couple Family Poverty
COMPARE
Immigrants from Northern Europe
Austrian
Married-Couple Family Poverty
Married-Couple Family Poverty Comparison
Immigrants from Northern Europe
Austrians
4.2%
MARRIED-COUPLE FAMILY POVERTY
99.8/ 100
METRIC RATING
39th/ 347
METRIC RANK
4.3%
MARRIED-COUPLE FAMILY POVERTY
99.7/ 100
METRIC RATING
54th/ 347
METRIC RANK
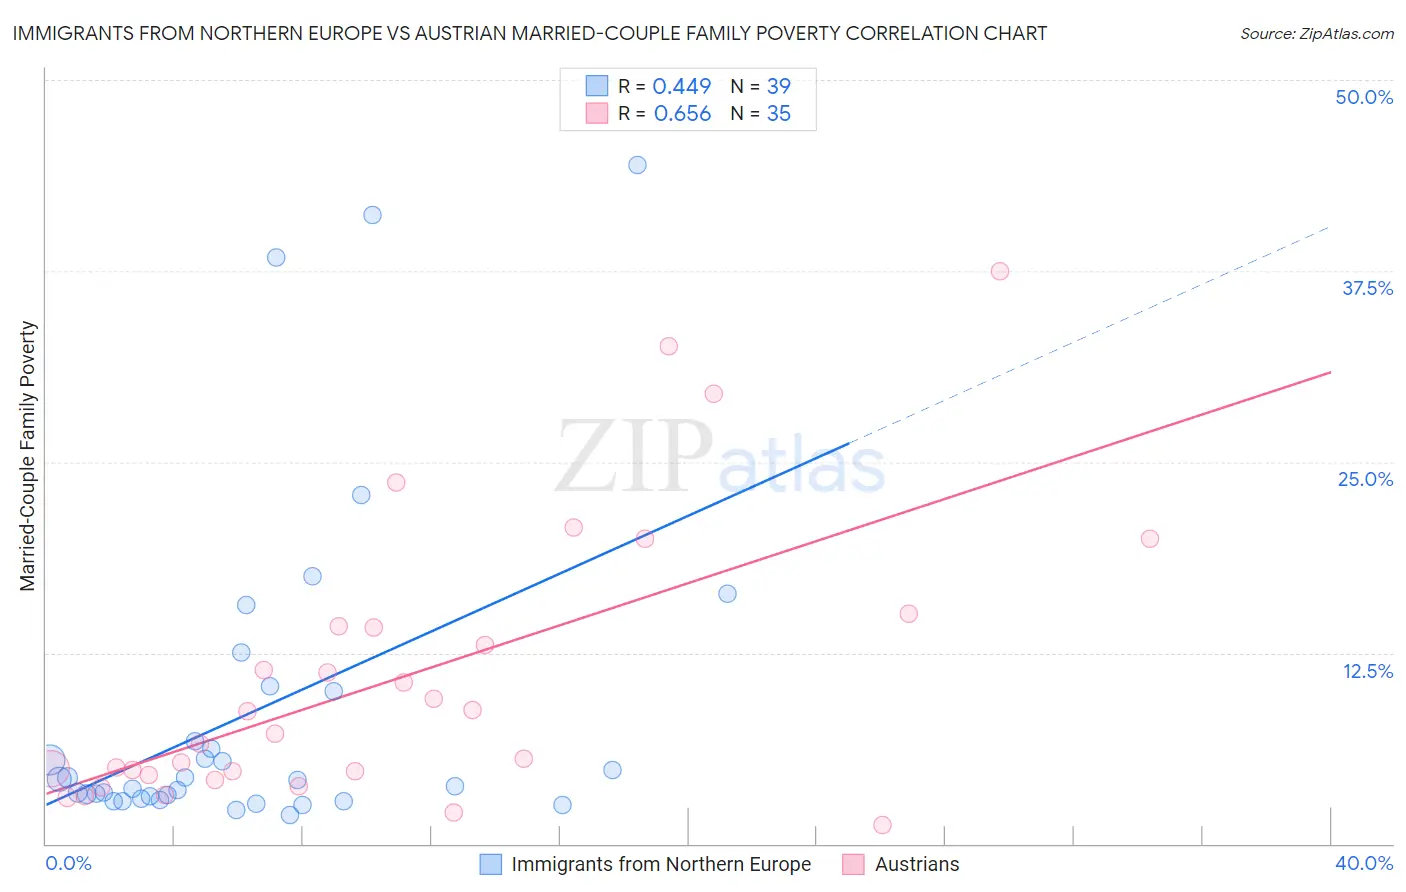
Immigrants from Northern Europe vs Austrian Married-Couple Family Poverty Correlation Chart
The statistical analysis conducted on geographies consisting of 470,220,521 people shows a moderate positive correlation between the proportion of Immigrants from Northern Europe and poverty level among married-couple families in the United States with a correlation coefficient (R) of 0.449 and weighted average of 4.2%. Similarly, the statistical analysis conducted on geographies consisting of 445,465,391 people shows a significant positive correlation between the proportion of Austrians and poverty level among married-couple families in the United States with a correlation coefficient (R) of 0.656 and weighted average of 4.3%, a difference of 2.4%.
Married-Couple Family Poverty Correlation Summary
| Measurement | Immigrants from Northern Europe | Austrian |
| Minimum | 1.9% | 1.3% |
| Maximum | 44.4% | 37.5% |
| Range | 42.6% | 36.2% |
| Mean | 8.6% | 10.8% |
| Median | 4.2% | 7.2% |
| Interquartile 25% (IQ1) | 3.0% | 4.5% |
| Interquartile 75% (IQ3) | 10.0% | 14.3% |
| Interquartile Range (IQR) | 7.0% | 9.8% |
| Standard Deviation (Sample) | 10.7% | 9.1% |
| Standard Deviation (Population) | 10.6% | 9.0% |
Demographics Similar to Immigrants from Northern Europe and Austrians by Married-Couple Family Poverty
In terms of married-couple family poverty, the demographic groups most similar to Immigrants from Northern Europe are Belgian (4.2%, a difference of 0.13%), Iranian (4.2%, a difference of 0.25%), French Canadian (4.2%, a difference of 0.28%), English (4.2%, a difference of 0.32%), and Northern European (4.3%, a difference of 0.53%). Similarly, the demographic groups most similar to Austrians are French (4.3%, a difference of 0.020%), Immigrants from Zimbabwe (4.3%, a difference of 0.18%), Welsh (4.3%, a difference of 0.26%), Russian (4.3%, a difference of 0.42%), and Immigrants from Lithuania (4.3%, a difference of 0.44%).
| Demographics | Rating | Rank | Married-Couple Family Poverty |
| English | 99.9 /100 | #36 | Exceptional 4.2% |
| Iranians | 99.9 /100 | #37 | Exceptional 4.2% |
| Belgians | 99.9 /100 | #38 | Exceptional 4.2% |
| Immigrants | Northern Europe | 99.8 /100 | #39 | Exceptional 4.2% |
| French Canadians | 99.8 /100 | #40 | Exceptional 4.2% |
| Northern Europeans | 99.8 /100 | #41 | Exceptional 4.3% |
| Scottish | 99.8 /100 | #42 | Exceptional 4.3% |
| Swiss | 99.8 /100 | #43 | Exceptional 4.3% |
| Immigrants | Japan | 99.8 /100 | #44 | Exceptional 4.3% |
| Serbians | 99.8 /100 | #45 | Exceptional 4.3% |
| British | 99.8 /100 | #46 | Exceptional 4.3% |
| Immigrants | South Central Asia | 99.8 /100 | #47 | Exceptional 4.3% |
| Australians | 99.7 /100 | #48 | Exceptional 4.3% |
| Turks | 99.7 /100 | #49 | Exceptional 4.3% |
| Burmese | 99.7 /100 | #50 | Exceptional 4.3% |
| Immigrants | Lithuania | 99.7 /100 | #51 | Exceptional 4.3% |
| Russians | 99.7 /100 | #52 | Exceptional 4.3% |
| Welsh | 99.7 /100 | #53 | Exceptional 4.3% |
| Austrians | 99.7 /100 | #54 | Exceptional 4.3% |
| French | 99.7 /100 | #55 | Exceptional 4.3% |
| Immigrants | Zimbabwe | 99.7 /100 | #56 | Exceptional 4.3% |