Immigrants from Russia vs Hungarian Single Father Poverty
COMPARE
Immigrants from Russia
Hungarian
Single Father Poverty
Single Father Poverty Comparison
Immigrants from Russia
Hungarians
15.5%
SINGLE FATHER POVERTY
99.0/ 100
METRIC RATING
86th/ 347
METRIC RANK
18.5%
SINGLE FATHER POVERTY
0.0/ 100
METRIC RATING
301st/ 347
METRIC RANK
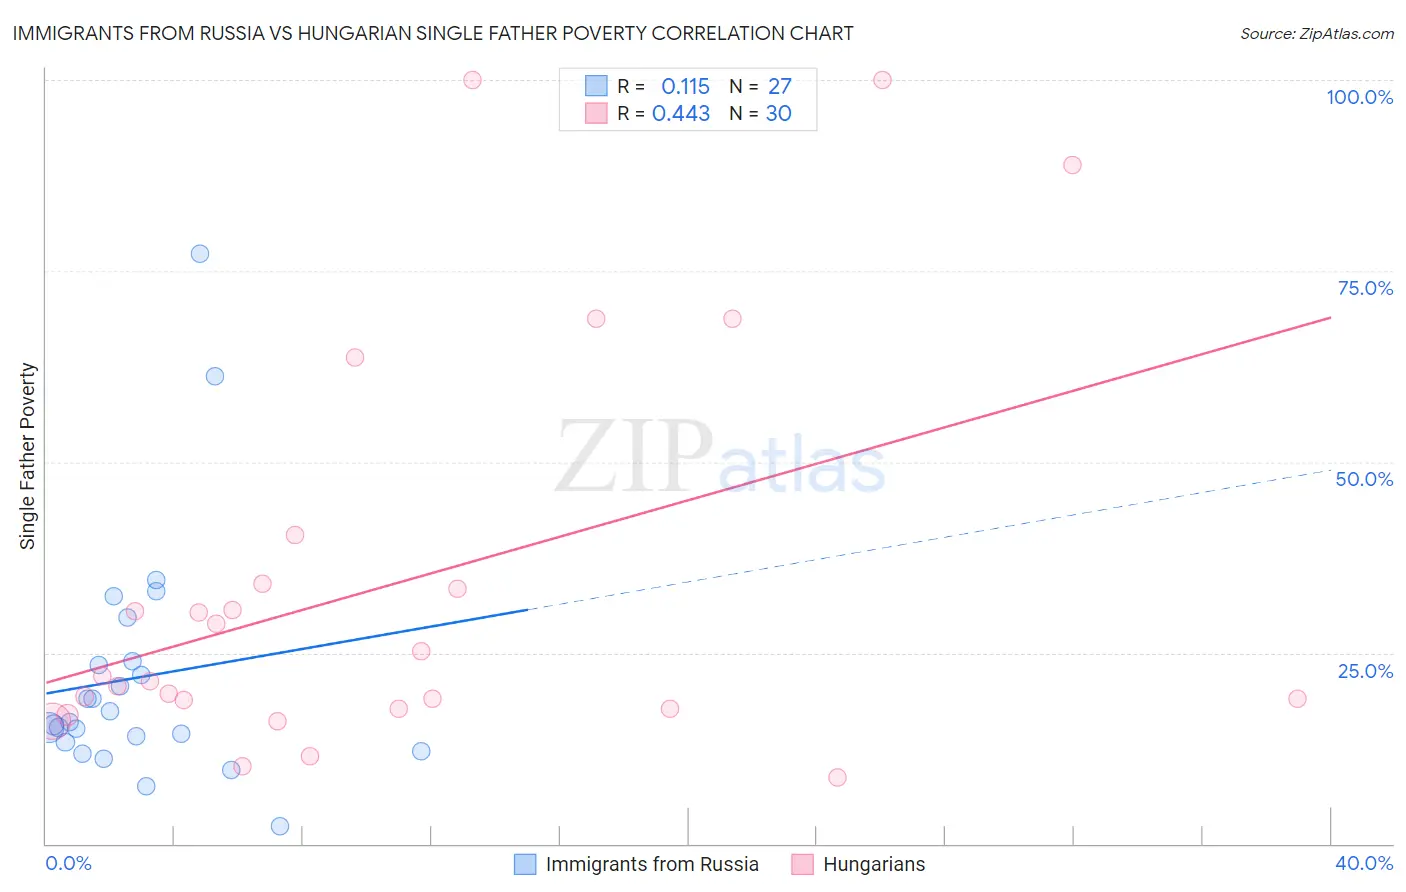
Immigrants from Russia vs Hungarian Single Father Poverty Correlation Chart
The statistical analysis conducted on geographies consisting of 273,488,054 people shows a poor positive correlation between the proportion of Immigrants from Russia and poverty level among single fathers in the United States with a correlation coefficient (R) of 0.115 and weighted average of 15.5%. Similarly, the statistical analysis conducted on geographies consisting of 362,286,644 people shows a moderate positive correlation between the proportion of Hungarians and poverty level among single fathers in the United States with a correlation coefficient (R) of 0.443 and weighted average of 18.5%, a difference of 19.4%.
Single Father Poverty Correlation Summary
| Measurement | Immigrants from Russia | Hungarian |
| Minimum | 2.4% | 8.6% |
| Maximum | 77.3% | 100.0% |
| Range | 74.9% | 91.4% |
| Mean | 21.7% | 33.9% |
| Median | 15.9% | 21.6% |
| Interquartile 25% (IQ1) | 13.3% | 17.7% |
| Interquartile 75% (IQ3) | 23.9% | 34.0% |
| Interquartile Range (IQR) | 10.6% | 16.3% |
| Standard Deviation (Sample) | 15.9% | 26.2% |
| Standard Deviation (Population) | 15.6% | 25.8% |
Similar Demographics by Single Father Poverty
Demographics Similar to Immigrants from Russia by Single Father Poverty
In terms of single father poverty, the demographic groups most similar to Immigrants from Russia are Brazilian (15.5%, a difference of 0.0%), Burmese (15.5%, a difference of 0.040%), Immigrants from Korea (15.5%, a difference of 0.10%), Immigrants from Oceania (15.4%, a difference of 0.12%), and Peruvian (15.4%, a difference of 0.24%).
| Demographics | Rating | Rank | Single Father Poverty |
| Immigrants | Northern Africa | 99.5 /100 | #79 | Exceptional 15.3% |
| Armenians | 99.4 /100 | #80 | Exceptional 15.4% |
| Immigrants | Congo | 99.4 /100 | #81 | Exceptional 15.4% |
| Immigrants | Ukraine | 99.4 /100 | #82 | Exceptional 15.4% |
| Chinese | 99.3 /100 | #83 | Exceptional 15.4% |
| Peruvians | 99.2 /100 | #84 | Exceptional 15.4% |
| Immigrants | Oceania | 99.1 /100 | #85 | Exceptional 15.4% |
| Immigrants | Russia | 99.0 /100 | #86 | Exceptional 15.5% |
| Brazilians | 99.0 /100 | #87 | Exceptional 15.5% |
| Burmese | 99.0 /100 | #88 | Exceptional 15.5% |
| Immigrants | Korea | 99.0 /100 | #89 | Exceptional 15.5% |
| Mexican American Indians | 98.7 /100 | #90 | Exceptional 15.5% |
| Immigrants | Romania | 98.6 /100 | #91 | Exceptional 15.5% |
| Immigrants | Serbia | 98.5 /100 | #92 | Exceptional 15.5% |
| Basques | 98.4 /100 | #93 | Exceptional 15.5% |
Demographics Similar to Hungarians by Single Father Poverty
In terms of single father poverty, the demographic groups most similar to Hungarians are Comanche (18.5%, a difference of 0.11%), Celtic (18.5%, a difference of 0.15%), Immigrants from Dominican Republic (18.4%, a difference of 0.22%), Ute (18.5%, a difference of 0.29%), and Blackfeet (18.5%, a difference of 0.34%).
| Demographics | Rating | Rank | Single Father Poverty |
| U.S. Virgin Islanders | 0.0 /100 | #294 | Tragic 18.1% |
| Yakama | 0.0 /100 | #295 | Tragic 18.1% |
| Seminole | 0.0 /100 | #296 | Tragic 18.1% |
| French | 0.0 /100 | #297 | Tragic 18.2% |
| Africans | 0.0 /100 | #298 | Tragic 18.3% |
| Whites/Caucasians | 0.0 /100 | #299 | Tragic 18.4% |
| Immigrants | Dominican Republic | 0.0 /100 | #300 | Tragic 18.4% |
| Hungarians | 0.0 /100 | #301 | Tragic 18.5% |
| Comanche | 0.0 /100 | #302 | Tragic 18.5% |
| Celtics | 0.0 /100 | #303 | Tragic 18.5% |
| Ute | 0.0 /100 | #304 | Tragic 18.5% |
| Blackfeet | 0.0 /100 | #305 | Tragic 18.5% |
| Scotch-Irish | 0.0 /100 | #306 | Tragic 18.6% |
| French Canadians | 0.0 /100 | #307 | Tragic 18.6% |
| Ottawa | 0.0 /100 | #308 | Tragic 18.6% |