Immigrants from South Eastern Asia vs Croatian Male Poverty
COMPARE
Immigrants from South Eastern Asia
Croatian
Male Poverty
Male Poverty Comparison
Immigrants from South Eastern Asia
Croatians
10.6%
MALE POVERTY
88.1/ 100
METRIC RATING
117th/ 347
METRIC RANK
9.6%
MALE POVERTY
99.7/ 100
METRIC RATING
22nd/ 347
METRIC RANK
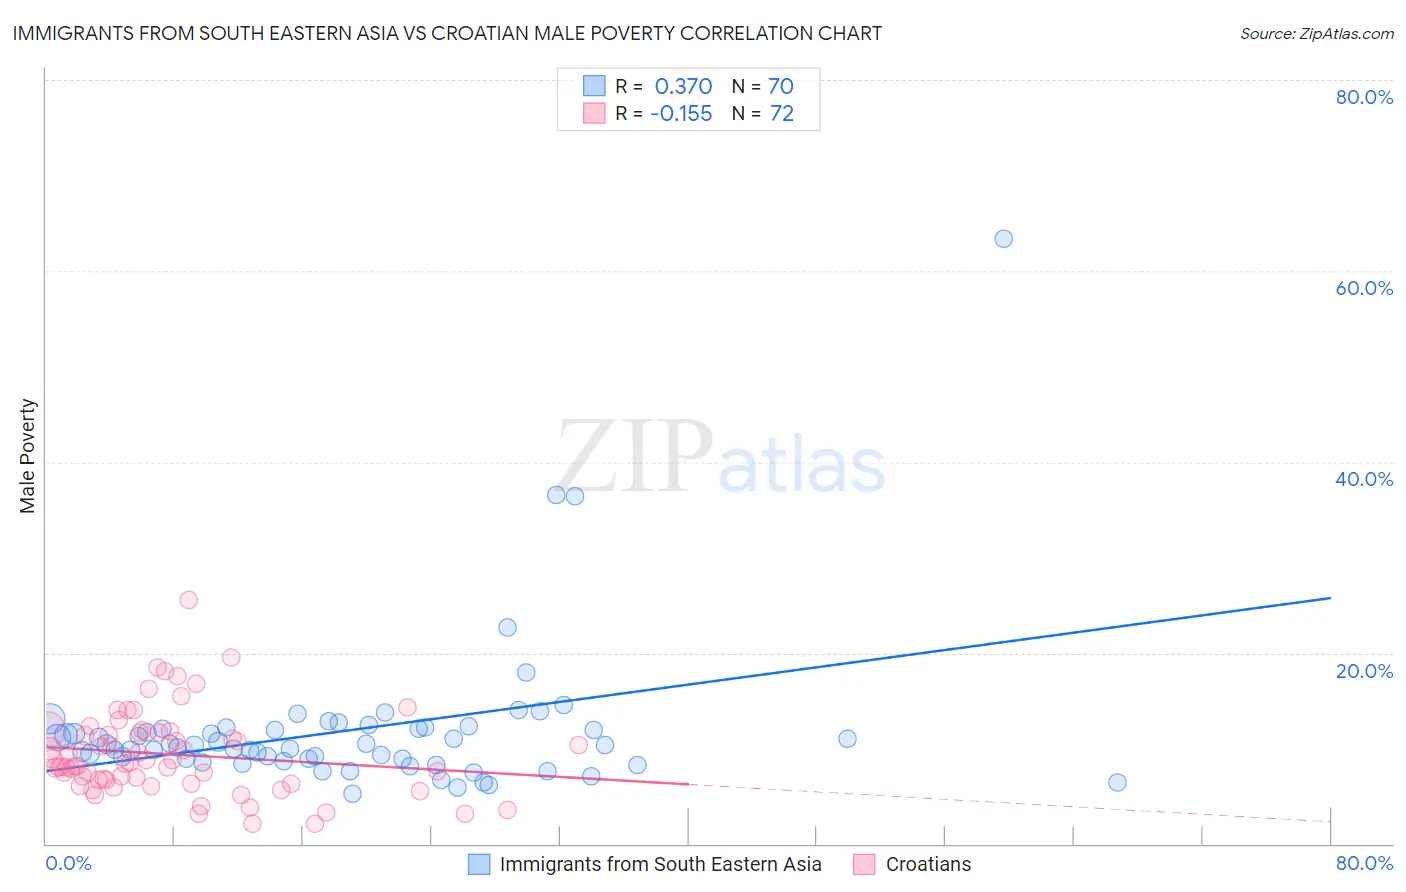
Immigrants from South Eastern Asia vs Croatian Male Poverty Correlation Chart
The statistical analysis conducted on geographies consisting of 511,932,643 people shows a mild positive correlation between the proportion of Immigrants from South Eastern Asia and poverty level among males in the United States with a correlation coefficient (R) of 0.370 and weighted average of 10.6%. Similarly, the statistical analysis conducted on geographies consisting of 375,378,387 people shows a poor negative correlation between the proportion of Croatians and poverty level among males in the United States with a correlation coefficient (R) of -0.155 and weighted average of 9.6%, a difference of 10.6%.
Male Poverty Correlation Summary
| Measurement | Immigrants from South Eastern Asia | Croatian |
| Minimum | 5.2% | 2.1% |
| Maximum | 63.3% | 25.5% |
| Range | 58.1% | 23.4% |
| Mean | 11.9% | 9.4% |
| Median | 10.3% | 8.2% |
| Interquartile 25% (IQ1) | 8.9% | 6.5% |
| Interquartile 75% (IQ3) | 12.1% | 11.6% |
| Interquartile Range (IQR) | 3.2% | 5.2% |
| Standard Deviation (Sample) | 8.1% | 4.4% |
| Standard Deviation (Population) | 8.0% | 4.4% |
Similar Demographics by Male Poverty
Demographics Similar to Immigrants from South Eastern Asia by Male Poverty
In terms of male poverty, the demographic groups most similar to Immigrants from South Eastern Asia are Sri Lankan (10.6%, a difference of 0.010%), Okinawan (10.7%, a difference of 0.11%), Immigrants from Hungary (10.7%, a difference of 0.12%), Immigrants from Russia (10.6%, a difference of 0.13%), and Immigrants from China (10.7%, a difference of 0.22%).
| Demographics | Rating | Rank | Male Poverty |
| Argentineans | 90.1 /100 | #110 | Exceptional 10.6% |
| Immigrants | Argentina | 89.8 /100 | #111 | Excellent 10.6% |
| Immigrants | Turkey | 89.5 /100 | #112 | Excellent 10.6% |
| Palestinians | 89.1 /100 | #113 | Excellent 10.6% |
| Immigrants | Brazil | 89.0 /100 | #114 | Excellent 10.6% |
| Immigrants | Russia | 88.6 /100 | #115 | Excellent 10.6% |
| Sri Lankans | 88.1 /100 | #116 | Excellent 10.6% |
| Immigrants | South Eastern Asia | 88.1 /100 | #117 | Excellent 10.6% |
| Okinawans | 87.6 /100 | #118 | Excellent 10.7% |
| Immigrants | Hungary | 87.6 /100 | #119 | Excellent 10.7% |
| Immigrants | China | 87.1 /100 | #120 | Excellent 10.7% |
| Peruvians | 87.1 /100 | #121 | Excellent 10.7% |
| Native Hawaiians | 87.0 /100 | #122 | Excellent 10.7% |
| South Africans | 86.8 /100 | #123 | Excellent 10.7% |
| French | 86.7 /100 | #124 | Excellent 10.7% |
Demographics Similar to Croatians by Male Poverty
In terms of male poverty, the demographic groups most similar to Croatians are Italian (9.6%, a difference of 0.010%), Swedish (9.6%, a difference of 0.090%), Eastern European (9.6%, a difference of 0.23%), Immigrants from Scotland (9.6%, a difference of 0.25%), and Latvian (9.6%, a difference of 0.51%).
| Demographics | Rating | Rank | Male Poverty |
| Bhutanese | 99.8 /100 | #15 | Exceptional 9.5% |
| Luxembourgers | 99.8 /100 | #16 | Exceptional 9.5% |
| Norwegians | 99.8 /100 | #17 | Exceptional 9.5% |
| Lithuanians | 99.8 /100 | #18 | Exceptional 9.5% |
| Immigrants | Hong Kong | 99.7 /100 | #19 | Exceptional 9.6% |
| Latvians | 99.7 /100 | #20 | Exceptional 9.6% |
| Immigrants | Scotland | 99.7 /100 | #21 | Exceptional 9.6% |
| Croatians | 99.7 /100 | #22 | Exceptional 9.6% |
| Italians | 99.7 /100 | #23 | Exceptional 9.6% |
| Swedes | 99.7 /100 | #24 | Exceptional 9.6% |
| Eastern Europeans | 99.6 /100 | #25 | Exceptional 9.6% |
| Burmese | 99.6 /100 | #26 | Exceptional 9.7% |
| Danes | 99.6 /100 | #27 | Exceptional 9.7% |
| Immigrants | Korea | 99.6 /100 | #28 | Exceptional 9.7% |
| Greeks | 99.6 /100 | #29 | Exceptional 9.7% |