Immigrants from Spain vs Immigrants from Singapore Child Poverty Among Girls Under 16
COMPARE
Immigrants from Spain
Immigrants from Singapore
Child Poverty Among Girls Under 16
Child Poverty Among Girls Under 16 Comparison
Immigrants from Spain
Immigrants from Singapore
15.5%
CHILD POVERTY AMONG GIRLS UNDER 16
89.1/ 100
METRIC RATING
134th/ 347
METRIC RANK
12.5%
CHILD POVERTY AMONG GIRLS UNDER 16
100.0/ 100
METRIC RATING
9th/ 347
METRIC RANK
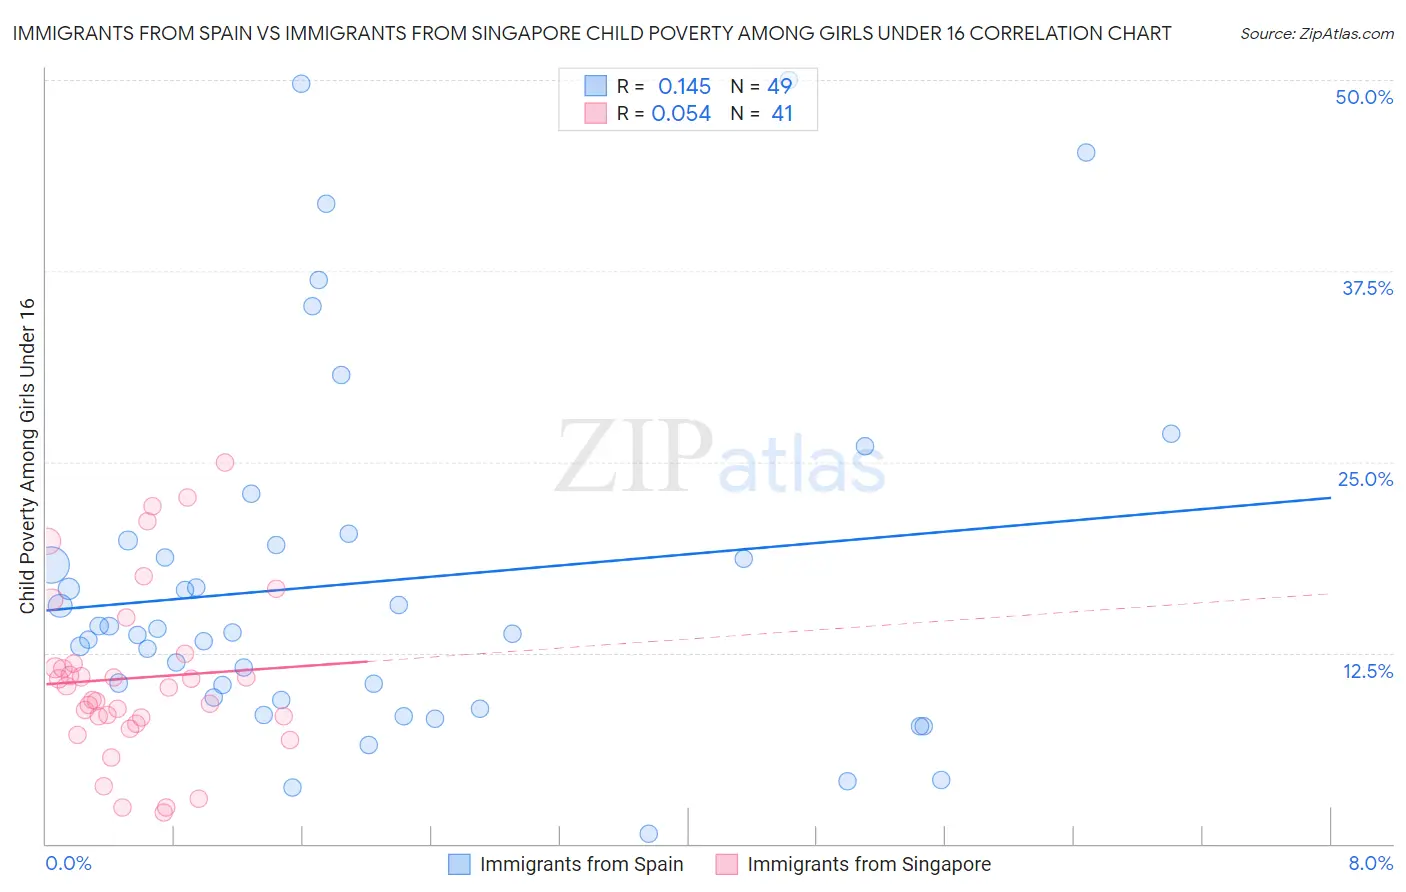
Immigrants from Spain vs Immigrants from Singapore Child Poverty Among Girls Under 16 Correlation Chart
The statistical analysis conducted on geographies consisting of 236,761,138 people shows a poor positive correlation between the proportion of Immigrants from Spain and poverty level among girls under the age of 16 in the United States with a correlation coefficient (R) of 0.145 and weighted average of 15.5%. Similarly, the statistical analysis conducted on geographies consisting of 136,137,761 people shows a slight positive correlation between the proportion of Immigrants from Singapore and poverty level among girls under the age of 16 in the United States with a correlation coefficient (R) of 0.054 and weighted average of 12.5%, a difference of 24.1%.
Child Poverty Among Girls Under 16 Correlation Summary
| Measurement | Immigrants from Spain | Immigrants from Singapore |
| Minimum | 0.69% | 2.0% |
| Maximum | 50.0% | 25.0% |
| Range | 49.3% | 23.0% |
| Mean | 17.1% | 10.9% |
| Median | 13.8% | 10.3% |
| Interquartile 25% (IQ1) | 9.5% | 8.1% |
| Interquartile 75% (IQ3) | 19.7% | 12.1% |
| Interquartile Range (IQR) | 10.2% | 4.0% |
| Standard Deviation (Sample) | 11.7% | 5.5% |
| Standard Deviation (Population) | 11.5% | 5.5% |
Similar Demographics by Child Poverty Among Girls Under 16
Demographics Similar to Immigrants from Spain by Child Poverty Among Girls Under 16
In terms of child poverty among girls under 16, the demographic groups most similar to Immigrants from Spain are Czechoslovakian (15.5%, a difference of 0.030%), Native Hawaiian (15.5%, a difference of 0.050%), South African (15.5%, a difference of 0.14%), Brazilian (15.4%, a difference of 0.16%), and Mongolian (15.4%, a difference of 0.17%).
| Demographics | Rating | Rank | Child Poverty Among Girls Under 16 |
| Immigrants | Norway | 90.8 /100 | #127 | Exceptional 15.4% |
| Albanians | 90.5 /100 | #128 | Exceptional 15.4% |
| Immigrants | South Eastern Asia | 90.5 /100 | #129 | Exceptional 15.4% |
| Puget Sound Salish | 90.1 /100 | #130 | Exceptional 15.4% |
| Immigrants | Western Europe | 90.0 /100 | #131 | Exceptional 15.4% |
| Mongolians | 89.7 /100 | #132 | Excellent 15.4% |
| Brazilians | 89.6 /100 | #133 | Excellent 15.4% |
| Immigrants | Spain | 89.1 /100 | #134 | Excellent 15.5% |
| Czechoslovakians | 89.0 /100 | #135 | Excellent 15.5% |
| Native Hawaiians | 89.0 /100 | #136 | Excellent 15.5% |
| South Africans | 88.7 /100 | #137 | Excellent 15.5% |
| Immigrants | Vietnam | 88.2 /100 | #138 | Excellent 15.5% |
| Armenians | 87.9 /100 | #139 | Excellent 15.5% |
| New Zealanders | 87.2 /100 | #140 | Excellent 15.6% |
| Immigrants | Jordan | 87.2 /100 | #141 | Excellent 15.6% |
Demographics Similar to Immigrants from Singapore by Child Poverty Among Girls Under 16
In terms of child poverty among girls under 16, the demographic groups most similar to Immigrants from Singapore are Iranian (12.4%, a difference of 0.43%), Immigrants from Iran (12.6%, a difference of 0.94%), Chinese (12.3%, a difference of 0.96%), Immigrants from Hong Kong (12.3%, a difference of 1.1%), and Immigrants from South Central Asia (12.7%, a difference of 2.2%).
| Demographics | Rating | Rank | Child Poverty Among Girls Under 16 |
| Immigrants | Taiwan | 100.0 /100 | #2 | Exceptional 11.3% |
| Filipinos | 100.0 /100 | #3 | Exceptional 11.4% |
| Tsimshian | 100.0 /100 | #4 | Exceptional 11.5% |
| Thais | 100.0 /100 | #5 | Exceptional 11.8% |
| Immigrants | Hong Kong | 100.0 /100 | #6 | Exceptional 12.3% |
| Chinese | 100.0 /100 | #7 | Exceptional 12.3% |
| Iranians | 100.0 /100 | #8 | Exceptional 12.4% |
| Immigrants | Singapore | 100.0 /100 | #9 | Exceptional 12.5% |
| Immigrants | Iran | 100.0 /100 | #10 | Exceptional 12.6% |
| Immigrants | South Central Asia | 100.0 /100 | #11 | Exceptional 12.7% |
| Bhutanese | 100.0 /100 | #12 | Exceptional 12.7% |
| Immigrants | Ireland | 99.9 /100 | #13 | Exceptional 12.9% |
| Burmese | 99.9 /100 | #14 | Exceptional 13.0% |
| Okinawans | 99.9 /100 | #15 | Exceptional 13.0% |
| Immigrants | Lithuania | 99.9 /100 | #16 | Exceptional 13.1% |