Immigrants from Taiwan vs Immigrants from Northern Africa Child Poverty Among Girls Under 16
COMPARE
Immigrants from Taiwan
Immigrants from Northern Africa
Child Poverty Among Girls Under 16
Child Poverty Among Girls Under 16 Comparison
Immigrants from Taiwan
Immigrants from Northern Africa
11.3%
CHILD POVERTY AMONG GIRLS UNDER 16
100.0/ 100
METRIC RATING
2nd/ 347
METRIC RANK
16.0%
CHILD POVERTY AMONG GIRLS UNDER 16
72.0/ 100
METRIC RATING
161st/ 347
METRIC RANK
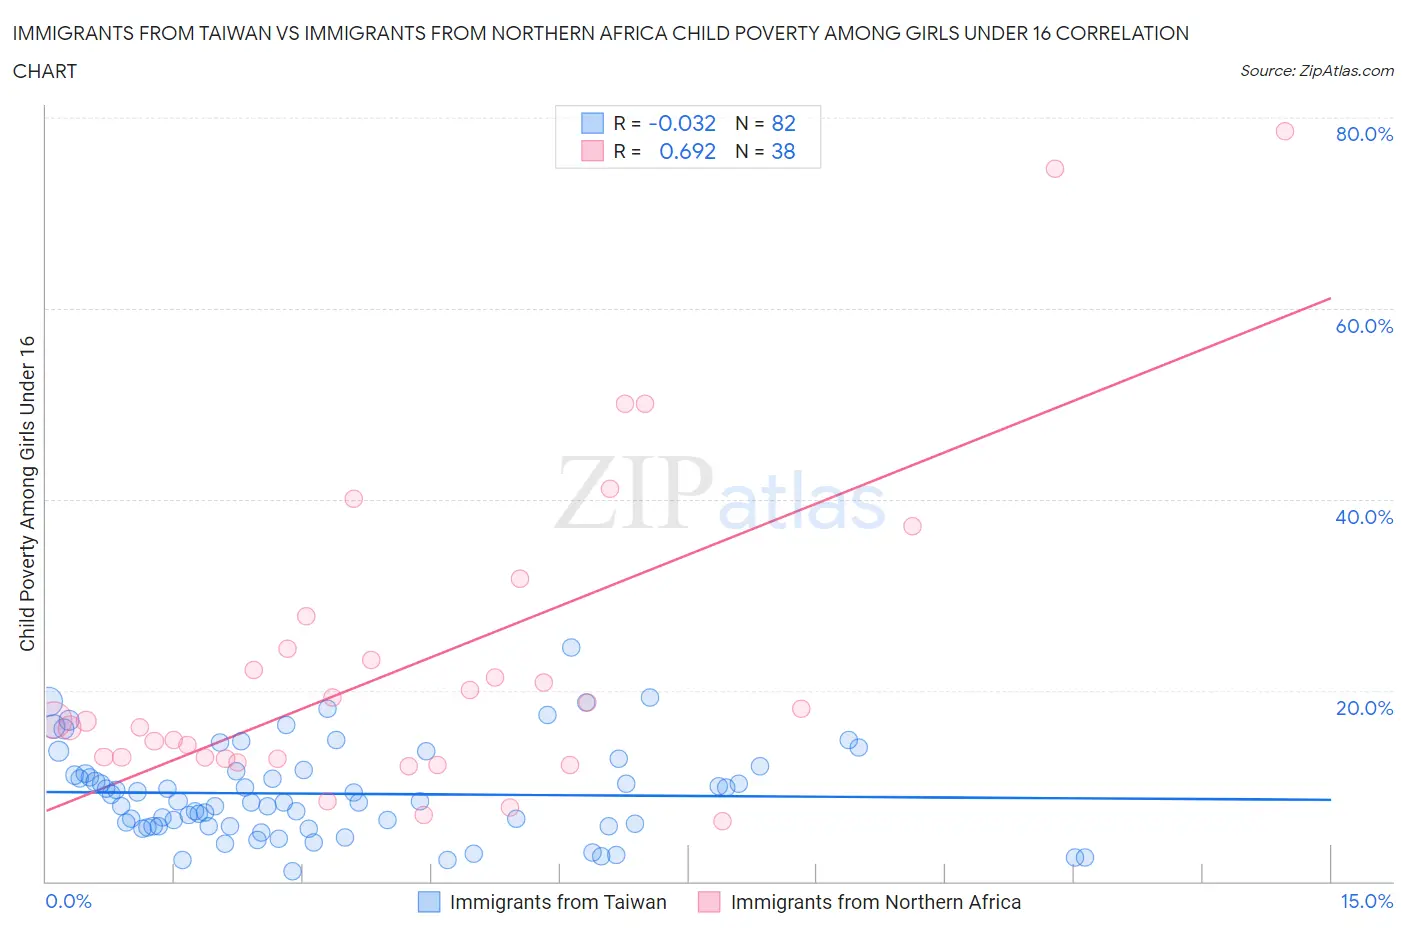
Immigrants from Taiwan vs Immigrants from Northern Africa Child Poverty Among Girls Under 16 Correlation Chart
The statistical analysis conducted on geographies consisting of 293,199,111 people shows no correlation between the proportion of Immigrants from Taiwan and poverty level among girls under the age of 16 in the United States with a correlation coefficient (R) of -0.032 and weighted average of 11.3%. Similarly, the statistical analysis conducted on geographies consisting of 316,657,809 people shows a significant positive correlation between the proportion of Immigrants from Northern Africa and poverty level among girls under the age of 16 in the United States with a correlation coefficient (R) of 0.692 and weighted average of 16.0%, a difference of 41.6%.
Child Poverty Among Girls Under 16 Correlation Summary
| Measurement | Immigrants from Taiwan | Immigrants from Northern Africa |
| Minimum | 1.1% | 6.2% |
| Maximum | 24.4% | 78.6% |
| Range | 23.4% | 72.3% |
| Mean | 9.2% | 22.9% |
| Median | 8.3% | 16.8% |
| Interquartile 25% (IQ1) | 5.8% | 12.8% |
| Interquartile 75% (IQ3) | 11.5% | 24.4% |
| Interquartile Range (IQR) | 5.7% | 11.6% |
| Standard Deviation (Sample) | 4.8% | 16.9% |
| Standard Deviation (Population) | 4.7% | 16.7% |
Similar Demographics by Child Poverty Among Girls Under 16
Demographics Similar to Immigrants from Taiwan by Child Poverty Among Girls Under 16
In terms of child poverty among girls under 16, the demographic groups most similar to Immigrants from Taiwan are Filipino (11.4%, a difference of 0.87%), Tsimshian (11.5%, a difference of 1.4%), Immigrants from India (11.0%, a difference of 2.6%), Thai (11.8%, a difference of 4.5%), and Immigrants from Hong Kong (12.3%, a difference of 8.9%).
| Demographics | Rating | Rank | Child Poverty Among Girls Under 16 |
| Immigrants | India | 100.0 /100 | #1 | Exceptional 11.0% |
| Immigrants | Taiwan | 100.0 /100 | #2 | Exceptional 11.3% |
| Filipinos | 100.0 /100 | #3 | Exceptional 11.4% |
| Tsimshian | 100.0 /100 | #4 | Exceptional 11.5% |
| Thais | 100.0 /100 | #5 | Exceptional 11.8% |
| Immigrants | Hong Kong | 100.0 /100 | #6 | Exceptional 12.3% |
| Chinese | 100.0 /100 | #7 | Exceptional 12.3% |
| Iranians | 100.0 /100 | #8 | Exceptional 12.4% |
| Immigrants | Singapore | 100.0 /100 | #9 | Exceptional 12.5% |
| Immigrants | Iran | 100.0 /100 | #10 | Exceptional 12.6% |
| Immigrants | South Central Asia | 100.0 /100 | #11 | Exceptional 12.7% |
| Bhutanese | 100.0 /100 | #12 | Exceptional 12.7% |
| Immigrants | Ireland | 99.9 /100 | #13 | Exceptional 12.9% |
| Burmese | 99.9 /100 | #14 | Exceptional 13.0% |
| Okinawans | 99.9 /100 | #15 | Exceptional 13.0% |
Demographics Similar to Immigrants from Northern Africa by Child Poverty Among Girls Under 16
In terms of child poverty among girls under 16, the demographic groups most similar to Immigrants from Northern Africa are French (16.0%, a difference of 0.11%), French Canadian (16.1%, a difference of 0.47%), Slovak (15.9%, a difference of 0.49%), Guamanian/Chamorro (15.9%, a difference of 0.50%), and Immigrants from Oceania (16.1%, a difference of 0.52%).
| Demographics | Rating | Rank | Child Poverty Among Girls Under 16 |
| Immigrants | Chile | 76.7 /100 | #154 | Good 15.9% |
| Syrians | 76.7 /100 | #155 | Good 15.9% |
| Immigrants | Fiji | 76.1 /100 | #156 | Good 15.9% |
| Colombians | 76.1 /100 | #157 | Good 15.9% |
| Guamanians/Chamorros | 75.3 /100 | #158 | Good 15.9% |
| Slovaks | 75.2 /100 | #159 | Good 15.9% |
| French | 72.8 /100 | #160 | Good 16.0% |
| Immigrants | Northern Africa | 72.0 /100 | #161 | Good 16.0% |
| French Canadians | 68.7 /100 | #162 | Good 16.1% |
| Immigrants | Oceania | 68.4 /100 | #163 | Good 16.1% |
| Immigrants | Colombia | 67.8 /100 | #164 | Good 16.1% |
| Immigrants | Germany | 67.3 /100 | #165 | Good 16.1% |
| South Americans | 67.2 /100 | #166 | Good 16.1% |
| Uruguayans | 64.7 /100 | #167 | Good 16.2% |
| Yugoslavians | 64.4 /100 | #168 | Good 16.2% |