Immigrants from Thailand vs Immigrants from Nicaragua Child Poverty Under the Age of 16
COMPARE
Immigrants from Thailand
Immigrants from Nicaragua
Child Poverty Under the Age of 16
Child Poverty Under the Age of 16 Comparison
Immigrants from Thailand
Immigrants from Nicaragua
17.5%
CHILD POVERTY UNDER THE AGE OF 16
6.6/ 100
METRIC RATING
211th/ 347
METRIC RANK
18.8%
CHILD POVERTY UNDER THE AGE OF 16
0.4/ 100
METRIC RATING
246th/ 347
METRIC RANK
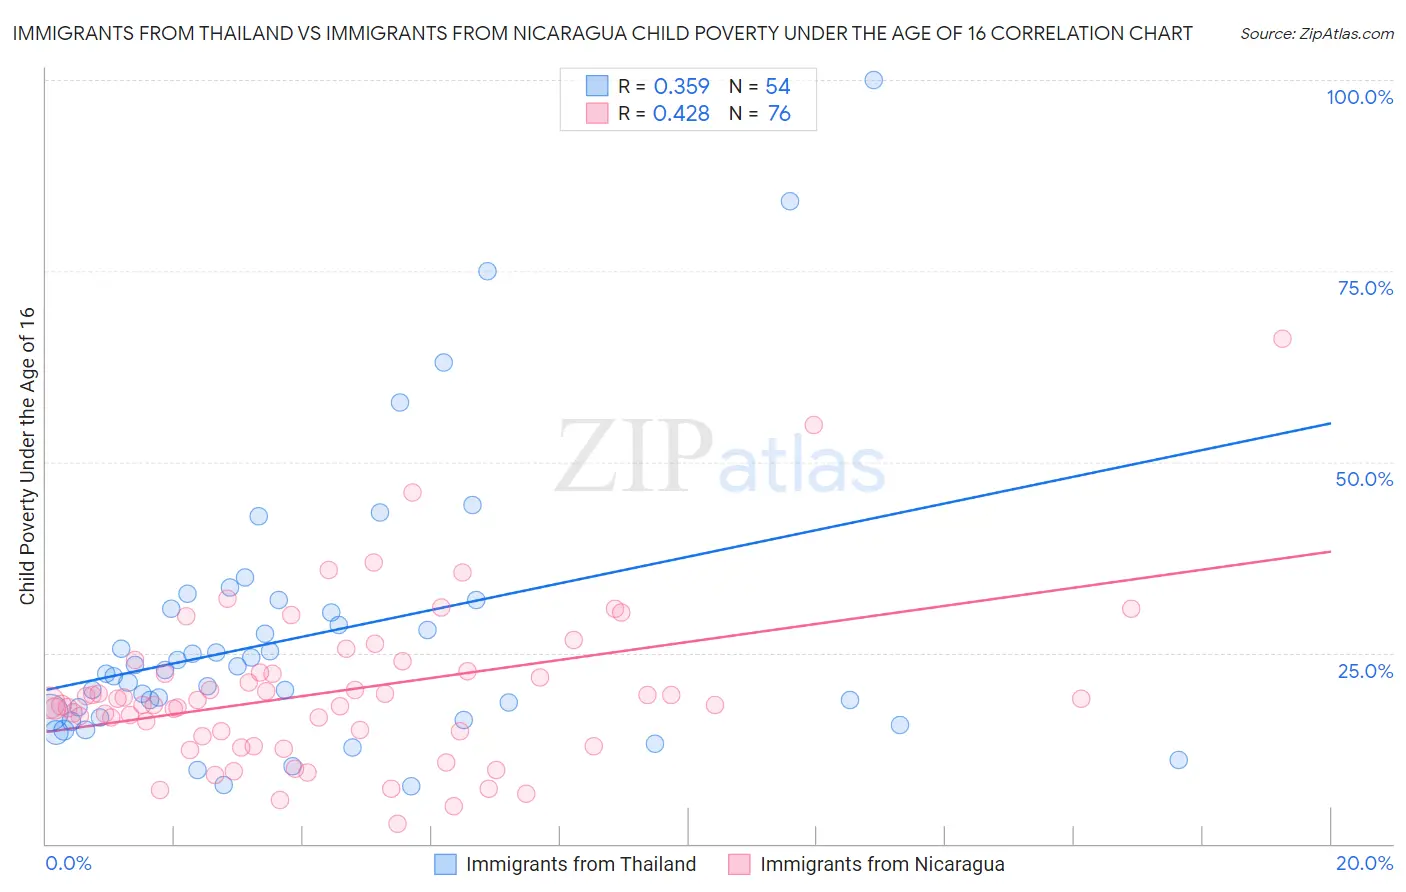
Immigrants from Thailand vs Immigrants from Nicaragua Child Poverty Under the Age of 16 Correlation Chart
The statistical analysis conducted on geographies consisting of 315,326,373 people shows a mild positive correlation between the proportion of Immigrants from Thailand and poverty level among children under the age of 16 in the United States with a correlation coefficient (R) of 0.359 and weighted average of 17.5%. Similarly, the statistical analysis conducted on geographies consisting of 235,832,733 people shows a moderate positive correlation between the proportion of Immigrants from Nicaragua and poverty level among children under the age of 16 in the United States with a correlation coefficient (R) of 0.428 and weighted average of 18.8%, a difference of 7.6%.
Child Poverty Under the Age of 16 Correlation Summary
| Measurement | Immigrants from Thailand | Immigrants from Nicaragua |
| Minimum | 7.5% | 2.6% |
| Maximum | 100.0% | 66.2% |
| Range | 92.5% | 63.6% |
| Mean | 27.3% | 20.0% |
| Median | 22.5% | 18.3% |
| Interquartile 25% (IQ1) | 16.5% | 14.3% |
| Interquartile 75% (IQ3) | 30.7% | 22.5% |
| Interquartile Range (IQR) | 14.2% | 8.1% |
| Standard Deviation (Sample) | 18.4% | 10.5% |
| Standard Deviation (Population) | 18.2% | 10.5% |
Similar Demographics by Child Poverty Under the Age of 16
Demographics Similar to Immigrants from Thailand by Child Poverty Under the Age of 16
In terms of child poverty under the age of 16, the demographic groups most similar to Immigrants from Thailand are Immigrants (17.5%, a difference of 0.020%), Alaskan Athabascan (17.5%, a difference of 0.12%), Panamanian (17.5%, a difference of 0.14%), Immigrants from the Azores (17.5%, a difference of 0.19%), and Iraqi (17.5%, a difference of 0.31%).
| Demographics | Rating | Rank | Child Poverty Under the Age of 16 |
| Hmong | 14.0 /100 | #204 | Poor 17.1% |
| Aleuts | 13.9 /100 | #205 | Poor 17.1% |
| Alaska Natives | 11.8 /100 | #206 | Poor 17.2% |
| German Russians | 8.6 /100 | #207 | Tragic 17.4% |
| Pennsylvania Germans | 7.5 /100 | #208 | Tragic 17.4% |
| Panamanians | 6.9 /100 | #209 | Tragic 17.5% |
| Alaskan Athabascans | 6.9 /100 | #210 | Tragic 17.5% |
| Immigrants | Thailand | 6.6 /100 | #211 | Tragic 17.5% |
| Immigrants | Immigrants | 6.5 /100 | #212 | Tragic 17.5% |
| Immigrants | Azores | 6.2 /100 | #213 | Tragic 17.5% |
| Iraqis | 5.9 /100 | #214 | Tragic 17.5% |
| Malaysians | 5.9 /100 | #215 | Tragic 17.5% |
| Sierra Leoneans | 5.7 /100 | #216 | Tragic 17.6% |
| Immigrants | Eastern Africa | 5.3 /100 | #217 | Tragic 17.6% |
| Moroccans | 5.3 /100 | #218 | Tragic 17.6% |
Demographics Similar to Immigrants from Nicaragua by Child Poverty Under the Age of 16
In terms of child poverty under the age of 16, the demographic groups most similar to Immigrants from Nicaragua are Shoshone (18.8%, a difference of 0.030%), French American Indian (18.9%, a difference of 0.24%), Ecuadorian (19.0%, a difference of 0.67%), Cape Verdean (18.7%, a difference of 0.68%), and Immigrants from Cuba (18.7%, a difference of 0.75%).
| Demographics | Rating | Rank | Child Poverty Under the Age of 16 |
| Immigrants | Sudan | 0.8 /100 | #239 | Tragic 18.5% |
| Ghanaians | 0.8 /100 | #240 | Tragic 18.6% |
| Alsatians | 0.7 /100 | #241 | Tragic 18.6% |
| Immigrants | Laos | 0.6 /100 | #242 | Tragic 18.7% |
| Immigrants | Cuba | 0.6 /100 | #243 | Tragic 18.7% |
| Cape Verdeans | 0.6 /100 | #244 | Tragic 18.7% |
| Shoshone | 0.5 /100 | #245 | Tragic 18.8% |
| Immigrants | Nicaragua | 0.4 /100 | #246 | Tragic 18.8% |
| French American Indians | 0.4 /100 | #247 | Tragic 18.9% |
| Ecuadorians | 0.3 /100 | #248 | Tragic 19.0% |
| Potawatomi | 0.3 /100 | #249 | Tragic 19.0% |
| Immigrants | Middle Africa | 0.3 /100 | #250 | Tragic 19.0% |
| Immigrants | Ghana | 0.3 /100 | #251 | Tragic 19.1% |
| Immigrants | Trinidad and Tobago | 0.3 /100 | #252 | Tragic 19.1% |
| Salvadorans | 0.3 /100 | #253 | Tragic 19.1% |