Immigrants from Uganda vs Bulgarian Female Poverty
COMPARE
Immigrants from Uganda
Bulgarian
Female Poverty
Female Poverty Comparison
Immigrants from Uganda
Bulgarians
13.7%
FEMALE POVERTY
28.5/ 100
METRIC RATING
198th/ 347
METRIC RANK
11.1%
FEMALE POVERTY
99.9/ 100
METRIC RATING
9th/ 347
METRIC RANK
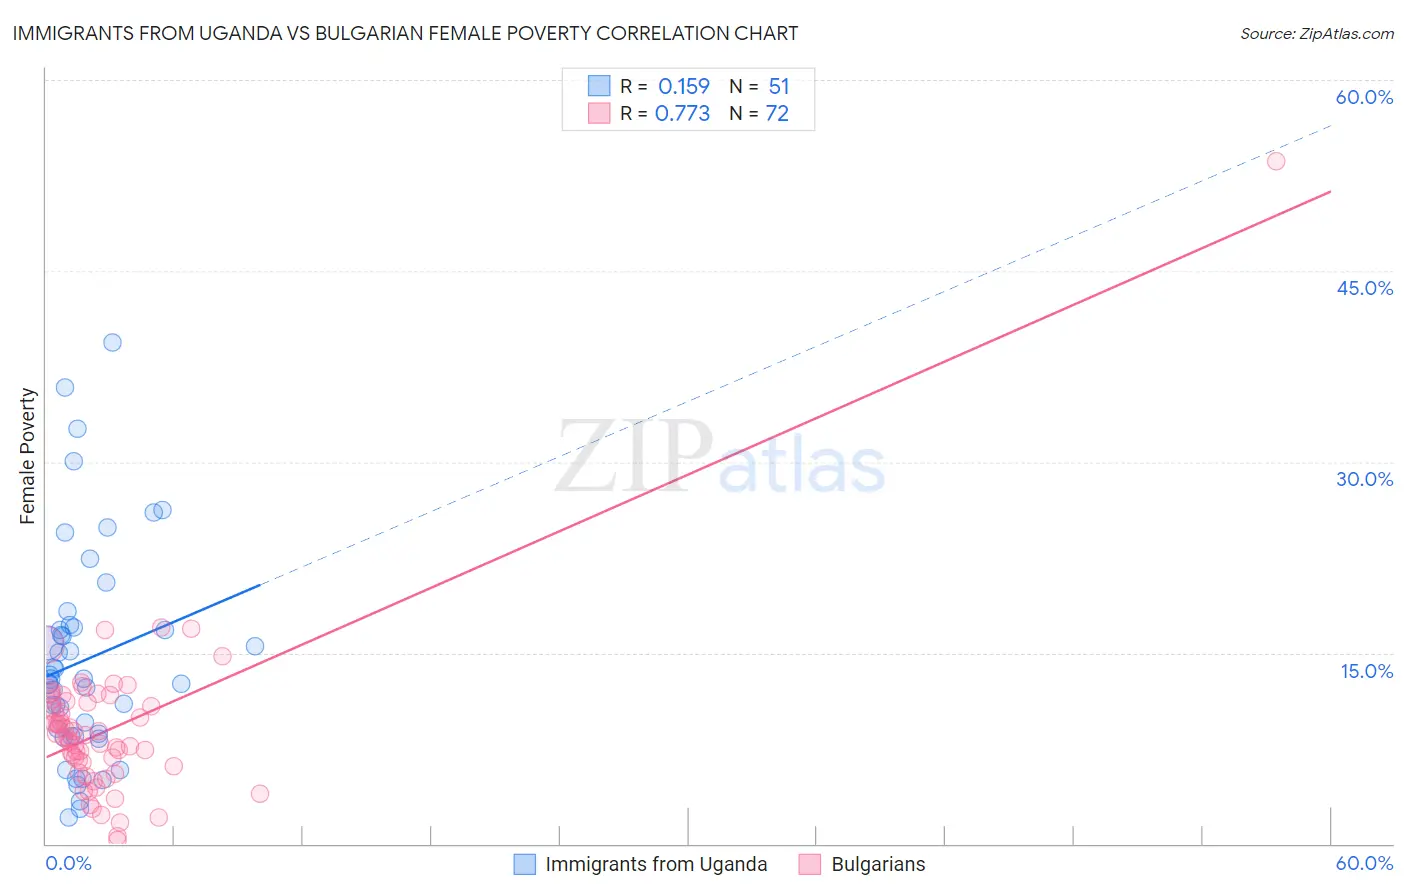
Immigrants from Uganda vs Bulgarian Female Poverty Correlation Chart
The statistical analysis conducted on geographies consisting of 125,969,010 people shows a poor positive correlation between the proportion of Immigrants from Uganda and poverty level among females in the United States with a correlation coefficient (R) of 0.159 and weighted average of 13.7%. Similarly, the statistical analysis conducted on geographies consisting of 205,544,553 people shows a strong positive correlation between the proportion of Bulgarians and poverty level among females in the United States with a correlation coefficient (R) of 0.773 and weighted average of 11.1%, a difference of 23.4%.
Female Poverty Correlation Summary
| Measurement | Immigrants from Uganda | Bulgarian |
| Minimum | 2.1% | 0.25% |
| Maximum | 39.4% | 53.6% |
| Range | 37.3% | 53.3% |
| Mean | 14.4% | 9.0% |
| Median | 12.9% | 8.5% |
| Interquartile 25% (IQ1) | 8.5% | 6.2% |
| Interquartile 75% (IQ3) | 17.0% | 11.1% |
| Interquartile Range (IQR) | 8.5% | 4.9% |
| Standard Deviation (Sample) | 8.4% | 6.5% |
| Standard Deviation (Population) | 8.3% | 6.4% |
Similar Demographics by Female Poverty
Demographics Similar to Immigrants from Uganda by Female Poverty
In terms of female poverty, the demographic groups most similar to Immigrants from Uganda are Arab (13.7%, a difference of 0.010%), South American Indian (13.7%, a difference of 0.060%), Immigrants from South America (13.7%, a difference of 0.25%), Delaware (13.7%, a difference of 0.30%), and Immigrants from Lebanon (13.8%, a difference of 0.34%).
| Demographics | Rating | Rank | Female Poverty |
| Immigrants | Kuwait | 32.7 /100 | #191 | Fair 13.7% |
| Immigrants | Costa Rica | 31.9 /100 | #192 | Fair 13.7% |
| Iraqis | 31.8 /100 | #193 | Fair 13.7% |
| Delaware | 31.1 /100 | #194 | Fair 13.7% |
| Immigrants | South America | 30.6 /100 | #195 | Fair 13.7% |
| South American Indians | 28.9 /100 | #196 | Fair 13.7% |
| Arabs | 28.6 /100 | #197 | Fair 13.7% |
| Immigrants | Uganda | 28.5 /100 | #198 | Fair 13.7% |
| Immigrants | Lebanon | 25.6 /100 | #199 | Fair 13.8% |
| Spanish | 21.4 /100 | #200 | Fair 13.9% |
| Immigrants | Kenya | 21.1 /100 | #201 | Fair 13.9% |
| Hmong | 21.1 /100 | #202 | Fair 13.9% |
| Immigrants | Western Asia | 20.7 /100 | #203 | Fair 13.9% |
| Spaniards | 18.9 /100 | #204 | Poor 13.9% |
| Ugandans | 15.4 /100 | #205 | Poor 14.0% |
Demographics Similar to Bulgarians by Female Poverty
In terms of female poverty, the demographic groups most similar to Bulgarians are Immigrants from South Central Asia (11.1%, a difference of 0.19%), Immigrants from Hong Kong (11.2%, a difference of 0.80%), Assyrian/Chaldean/Syriac (11.0%, a difference of 0.89%), Maltese (11.2%, a difference of 0.91%), and Immigrants from Ireland (11.0%, a difference of 1.3%).
| Demographics | Rating | Rank | Female Poverty |
| Chinese | 100.0 /100 | #2 | Exceptional 10.4% |
| Thais | 100.0 /100 | #3 | Exceptional 10.5% |
| Immigrants | Taiwan | 100.0 /100 | #4 | Exceptional 10.5% |
| Filipinos | 100.0 /100 | #5 | Exceptional 10.9% |
| Immigrants | Ireland | 99.9 /100 | #6 | Exceptional 11.0% |
| Assyrians/Chaldeans/Syriacs | 99.9 /100 | #7 | Exceptional 11.0% |
| Immigrants | South Central Asia | 99.9 /100 | #8 | Exceptional 11.1% |
| Bulgarians | 99.9 /100 | #9 | Exceptional 11.1% |
| Immigrants | Hong Kong | 99.9 /100 | #10 | Exceptional 11.2% |
| Maltese | 99.9 /100 | #11 | Exceptional 11.2% |
| Bhutanese | 99.9 /100 | #12 | Exceptional 11.3% |
| Immigrants | Lithuania | 99.9 /100 | #13 | Exceptional 11.3% |
| Lithuanians | 99.8 /100 | #14 | Exceptional 11.4% |
| Latvians | 99.8 /100 | #15 | Exceptional 11.4% |
| Immigrants | Bolivia | 99.8 /100 | #16 | Exceptional 11.5% |