Immigrants from Uganda vs Paiute Seniors Poverty Over the Age of 75
COMPARE
Immigrants from Uganda
Paiute
Seniors Poverty Over the Age of 75
Seniors Poverty Over the Age of 75 Comparison
Immigrants from Uganda
Paiute
11.8%
SENIORS POVERTY OVER THE AGE OF 75
84.8/ 100
METRIC RATING
119th/ 347
METRIC RANK
15.2%
SENIORS POVERTY OVER THE AGE OF 75
0.0/ 100
METRIC RATING
291st/ 347
METRIC RANK
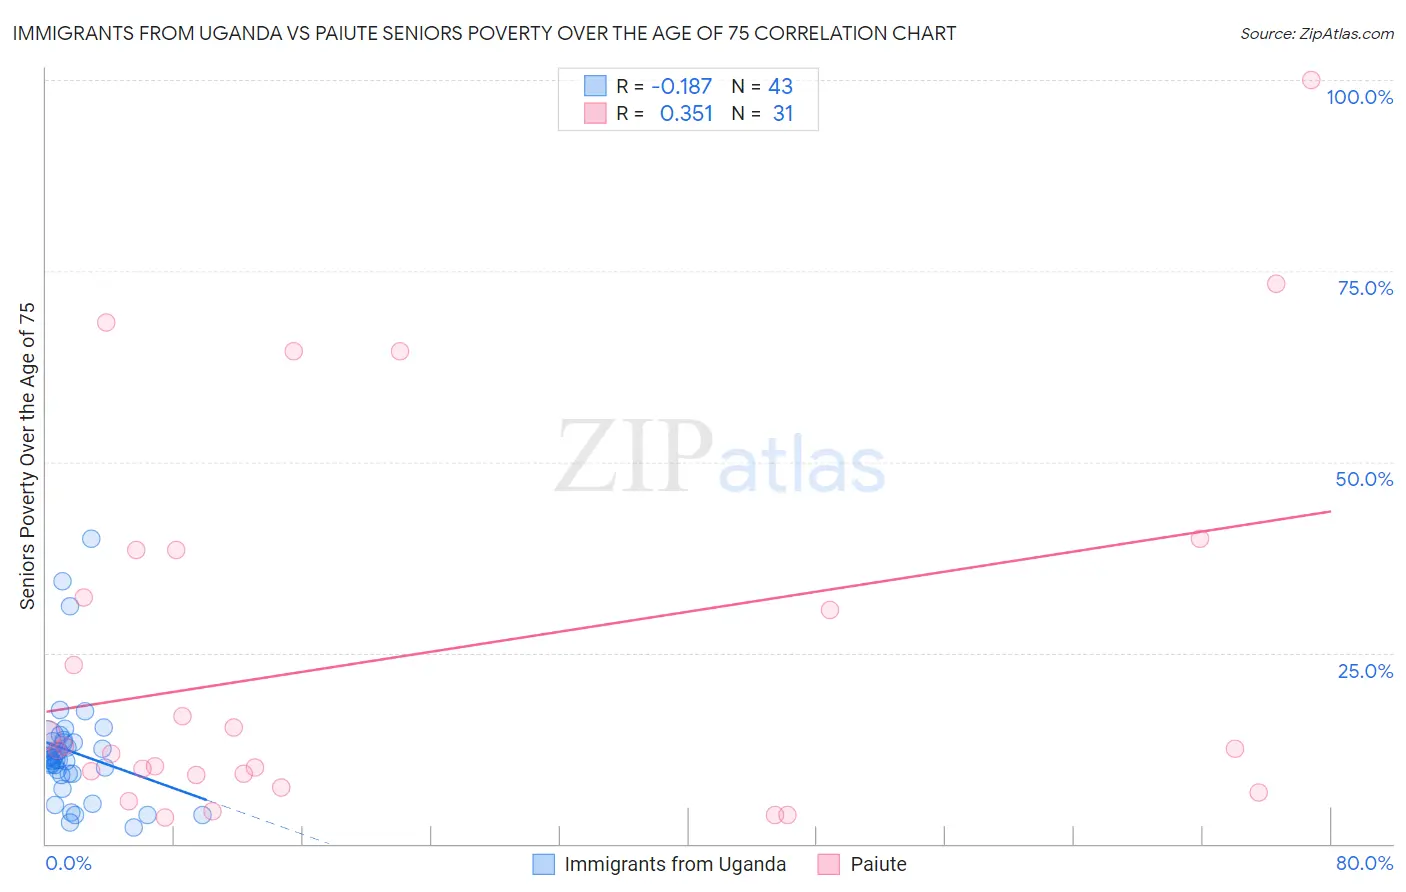
Immigrants from Uganda vs Paiute Seniors Poverty Over the Age of 75 Correlation Chart
The statistical analysis conducted on geographies consisting of 125,579,986 people shows a poor negative correlation between the proportion of Immigrants from Uganda and poverty level among seniors over the age of 75 in the United States with a correlation coefficient (R) of -0.187 and weighted average of 11.8%. Similarly, the statistical analysis conducted on geographies consisting of 58,252,540 people shows a mild positive correlation between the proportion of Paiute and poverty level among seniors over the age of 75 in the United States with a correlation coefficient (R) of 0.351 and weighted average of 15.2%, a difference of 29.1%.
Seniors Poverty Over the Age of 75 Correlation Summary
| Measurement | Immigrants from Uganda | Paiute |
| Minimum | 2.1% | 3.5% |
| Maximum | 40.0% | 100.0% |
| Range | 37.9% | 96.5% |
| Mean | 12.0% | 24.6% |
| Median | 11.0% | 12.5% |
| Interquartile 25% (IQ1) | 9.2% | 9.0% |
| Interquartile 75% (IQ3) | 13.4% | 38.5% |
| Interquartile Range (IQR) | 4.2% | 29.5% |
| Standard Deviation (Sample) | 7.5% | 25.0% |
| Standard Deviation (Population) | 7.4% | 24.6% |
Similar Demographics by Seniors Poverty Over the Age of 75
Demographics Similar to Immigrants from Uganda by Seniors Poverty Over the Age of 75
In terms of seniors poverty over the age of 75, the demographic groups most similar to Immigrants from Uganda are Immigrants from Nepal (11.8%, a difference of 0.040%), Malaysian (11.8%, a difference of 0.11%), Pakistani (11.8%, a difference of 0.12%), Immigrants from Italy (11.8%, a difference of 0.12%), and Immigrants from Zimbabwe (11.7%, a difference of 0.13%).
| Demographics | Rating | Rank | Seniors Poverty Over the Age of 75 |
| Immigrants | Bolivia | 88.4 /100 | #112 | Excellent 11.7% |
| Immigrants | Czechoslovakia | 87.0 /100 | #113 | Excellent 11.7% |
| Ukrainians | 86.9 /100 | #114 | Excellent 11.7% |
| New Zealanders | 86.3 /100 | #115 | Excellent 11.7% |
| Iraqis | 86.3 /100 | #116 | Excellent 11.7% |
| Icelanders | 85.7 /100 | #117 | Excellent 11.7% |
| Immigrants | Zimbabwe | 85.5 /100 | #118 | Excellent 11.7% |
| Immigrants | Uganda | 84.8 /100 | #119 | Excellent 11.8% |
| Immigrants | Nepal | 84.5 /100 | #120 | Excellent 11.8% |
| Malaysians | 84.1 /100 | #121 | Excellent 11.8% |
| Pakistanis | 84.0 /100 | #122 | Excellent 11.8% |
| Immigrants | Italy | 84.0 /100 | #123 | Excellent 11.8% |
| Fijians | 83.8 /100 | #124 | Excellent 11.8% |
| Sudanese | 83.6 /100 | #125 | Excellent 11.8% |
| Pennsylvania Germans | 83.4 /100 | #126 | Excellent 11.8% |
Demographics Similar to Paiute by Seniors Poverty Over the Age of 75
In terms of seniors poverty over the age of 75, the demographic groups most similar to Paiute are Immigrants from the Azores (15.2%, a difference of 0.020%), Immigrants from Belize (15.2%, a difference of 0.030%), Colville (15.2%, a difference of 0.18%), Jamaican (15.1%, a difference of 0.29%), and Apache (15.3%, a difference of 0.58%).
| Demographics | Rating | Rank | Seniors Poverty Over the Age of 75 |
| Cheyenne | 0.0 /100 | #284 | Tragic 14.9% |
| Immigrants | Mexico | 0.0 /100 | #285 | Tragic 14.9% |
| Immigrants | Central America | 0.0 /100 | #286 | Tragic 15.0% |
| Immigrants | Guatemala | 0.0 /100 | #287 | Tragic 15.1% |
| Jamaicans | 0.0 /100 | #288 | Tragic 15.1% |
| Immigrants | Belize | 0.0 /100 | #289 | Tragic 15.2% |
| Immigrants | Azores | 0.0 /100 | #290 | Tragic 15.2% |
| Paiute | 0.0 /100 | #291 | Tragic 15.2% |
| Colville | 0.0 /100 | #292 | Tragic 15.2% |
| Apache | 0.0 /100 | #293 | Tragic 15.3% |
| Immigrants | Jamaica | 0.0 /100 | #294 | Tragic 15.3% |
| U.S. Virgin Islanders | 0.0 /100 | #295 | Tragic 15.4% |
| Yuman | 0.0 /100 | #296 | Tragic 15.4% |
| Hondurans | 0.0 /100 | #297 | Tragic 15.4% |
| Natives/Alaskans | 0.0 /100 | #298 | Tragic 15.5% |