Immigrants from Zaire vs Immigrants from Poland Female Poverty
COMPARE
Immigrants from Zaire
Immigrants from Poland
Female Poverty
Female Poverty Comparison
Immigrants from Zaire
Immigrants from Poland
16.4%
FEMALE POVERTY
0.0/ 100
METRIC RATING
292nd/ 347
METRIC RANK
11.8%
FEMALE POVERTY
99.3/ 100
METRIC RATING
39th/ 347
METRIC RANK
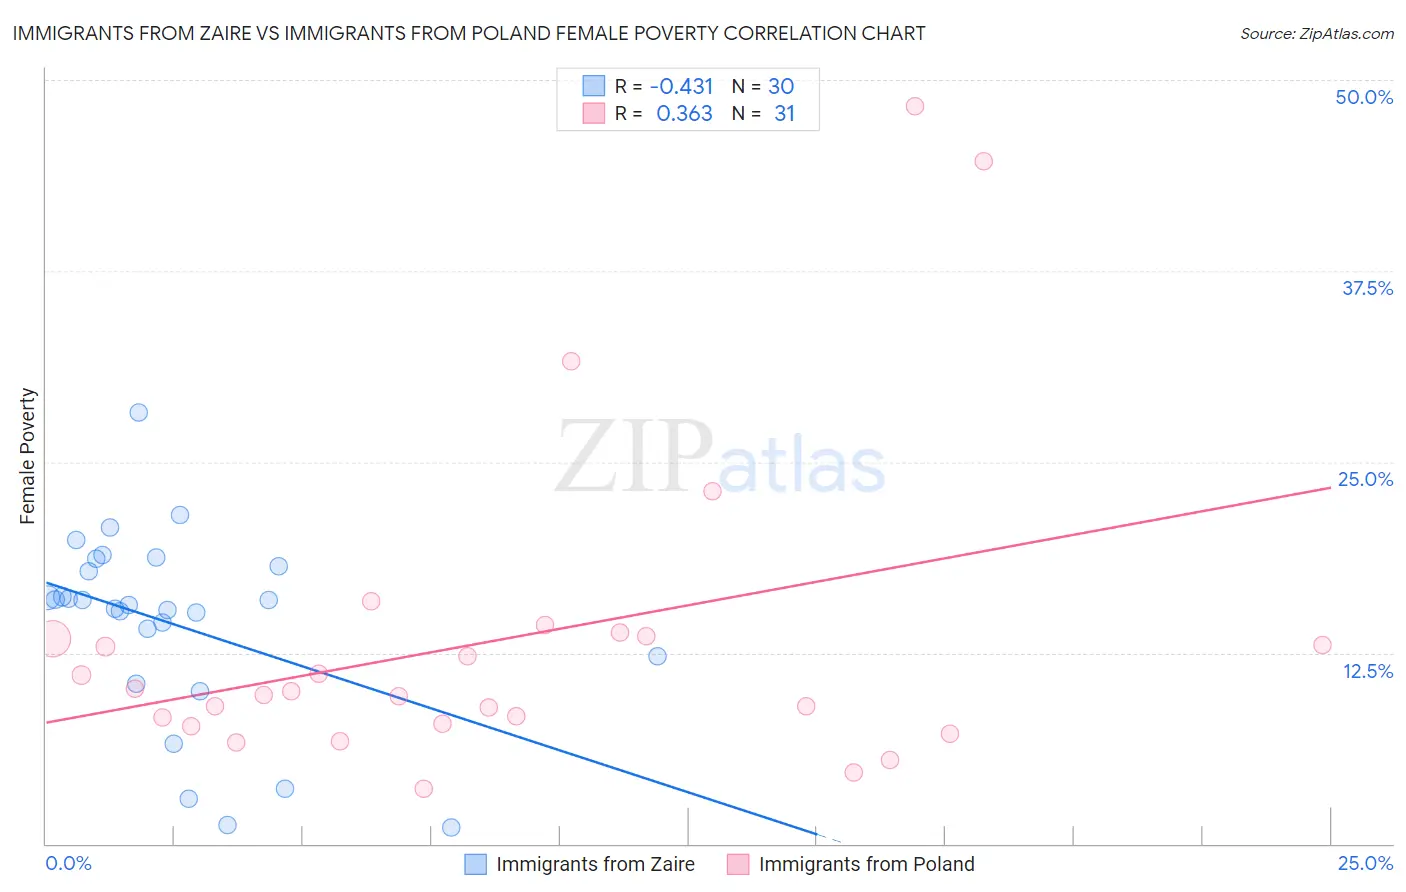
Immigrants from Zaire vs Immigrants from Poland Female Poverty Correlation Chart
The statistical analysis conducted on geographies consisting of 107,241,785 people shows a moderate negative correlation between the proportion of Immigrants from Zaire and poverty level among females in the United States with a correlation coefficient (R) of -0.431 and weighted average of 16.4%. Similarly, the statistical analysis conducted on geographies consisting of 304,710,065 people shows a mild positive correlation between the proportion of Immigrants from Poland and poverty level among females in the United States with a correlation coefficient (R) of 0.363 and weighted average of 11.8%, a difference of 38.7%.
Female Poverty Correlation Summary
| Measurement | Immigrants from Zaire | Immigrants from Poland |
| Minimum | 1.0% | 3.6% |
| Maximum | 28.2% | 48.3% |
| Range | 27.2% | 44.7% |
| Mean | 14.4% | 13.3% |
| Median | 15.8% | 10.0% |
| Interquartile 25% (IQ1) | 12.3% | 7.9% |
| Interquartile 75% (IQ3) | 18.2% | 13.6% |
| Interquartile Range (IQR) | 5.9% | 5.7% |
| Standard Deviation (Sample) | 6.2% | 10.4% |
| Standard Deviation (Population) | 6.1% | 10.2% |
Similar Demographics by Female Poverty
Demographics Similar to Immigrants from Zaire by Female Poverty
In terms of female poverty, the demographic groups most similar to Immigrants from Zaire are Yaqui (16.4%, a difference of 0.010%), Immigrants from Latin America (16.4%, a difference of 0.060%), Immigrants from Cabo Verde (16.4%, a difference of 0.090%), Senegalese (16.5%, a difference of 0.17%), and Immigrants from Bangladesh (16.4%, a difference of 0.18%).
| Demographics | Rating | Rank | Female Poverty |
| Comanche | 0.0 /100 | #285 | Tragic 16.2% |
| Inupiat | 0.0 /100 | #286 | Tragic 16.2% |
| Immigrants | Belize | 0.0 /100 | #287 | Tragic 16.3% |
| Indonesians | 0.0 /100 | #288 | Tragic 16.4% |
| Blackfeet | 0.0 /100 | #289 | Tragic 16.4% |
| Immigrants | Bangladesh | 0.0 /100 | #290 | Tragic 16.4% |
| Yaqui | 0.0 /100 | #291 | Tragic 16.4% |
| Immigrants | Zaire | 0.0 /100 | #292 | Tragic 16.4% |
| Immigrants | Latin America | 0.0 /100 | #293 | Tragic 16.4% |
| Immigrants | Cabo Verde | 0.0 /100 | #294 | Tragic 16.4% |
| Senegalese | 0.0 /100 | #295 | Tragic 16.5% |
| Immigrants | Senegal | 0.0 /100 | #296 | Tragic 16.5% |
| Mexicans | 0.0 /100 | #297 | Tragic 16.5% |
| Somalis | 0.0 /100 | #298 | Tragic 16.6% |
| Hispanics or Latinos | 0.0 /100 | #299 | Tragic 16.6% |
Demographics Similar to Immigrants from Poland by Female Poverty
In terms of female poverty, the demographic groups most similar to Immigrants from Poland are Macedonian (11.8%, a difference of 0.050%), Russian (11.8%, a difference of 0.21%), Immigrants from Greece (11.8%, a difference of 0.22%), Czech (11.9%, a difference of 0.23%), and Immigrants from Moldova (11.9%, a difference of 0.23%).
| Demographics | Rating | Rank | Female Poverty |
| Danes | 99.5 /100 | #32 | Exceptional 11.7% |
| Cypriots | 99.5 /100 | #33 | Exceptional 11.8% |
| Immigrants | Singapore | 99.4 /100 | #34 | Exceptional 11.8% |
| Immigrants | Iran | 99.4 /100 | #35 | Exceptional 11.8% |
| Immigrants | Pakistan | 99.4 /100 | #36 | Exceptional 11.8% |
| Immigrants | Greece | 99.3 /100 | #37 | Exceptional 11.8% |
| Russians | 99.3 /100 | #38 | Exceptional 11.8% |
| Immigrants | Poland | 99.3 /100 | #39 | Exceptional 11.8% |
| Macedonians | 99.3 /100 | #40 | Exceptional 11.8% |
| Czechs | 99.2 /100 | #41 | Exceptional 11.9% |
| Immigrants | Moldova | 99.2 /100 | #42 | Exceptional 11.9% |
| Koreans | 99.2 /100 | #43 | Exceptional 11.9% |
| Tongans | 99.2 /100 | #44 | Exceptional 11.9% |
| Immigrants | Czechoslovakia | 99.2 /100 | #45 | Exceptional 11.9% |
| Turks | 99.2 /100 | #46 | Exceptional 11.9% |